
Fig. 2
- ID
- ZDB-FIG-250213-27
- Publication
- He et al., 2025 - An antagonistic role of clock genes and lima1 in kidney regeneration
- Other Figures
- All Figure Page
- Back to All Figure Page
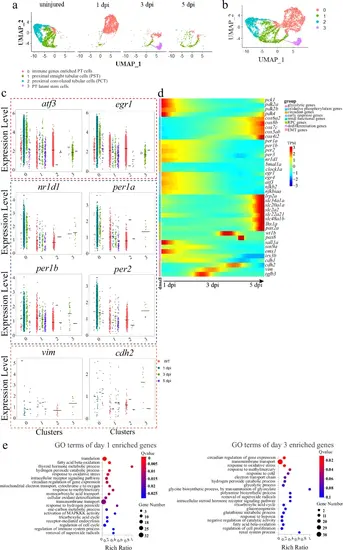
Dynamic gene expression of the 4 PT subclusters during renal regeneration.a UMAP embedding of scRNA-seq data colored by time points highlights the progressive nature of 4 subclusters during regeneration. b UMAP embedding of all cells profiled during early stages of renal regeneration. c Violin plots showing dynamic expression of the indicated genes, grouped into markers of early response, RPCs, circadian clock and EMT. The colored boxes were used to highlight the indicated groups. 0–3 of the X-axis: the subclusters 0–3. d Heat map showing the dynamic expression of the indicated genes, grouped into 8 categories that are shown on the upper right corner. e GO terms of the enriched genes at 1 and 3 dpi. |