
Fig. 5
- ID
- ZDB-FIG-250207-8
- Publication
- Hua et al., 2025 - Novel Transgenic Zebrafish Lines to Study the CHRNA3-B4-A5 Gene Cluster
- Other Figures
- All Figure Page
- Back to All Figure Page
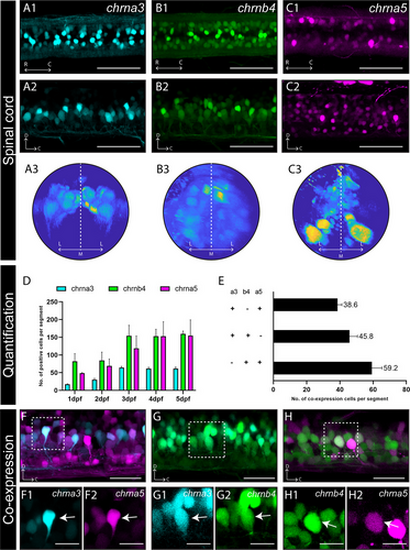
Expression of chrna3tdTomato, chrnb4eGFP, and chrna5tdTomato in the spinal cord. (A1–C1) Dorsal view of the spinal cord of each transgenic line. (A2–C2) Lateral view of the spinal cord of each transgenic line. (A3–C3) Transverse view of the spinal cord of each transgenic line, color gradient represents levels of fluorescence (yellow = stronger/blue = weaker). (D) Quantification of positive cells per segment was counted from Days 1 to 5, n = 5 fish for each transgenic line. (E) Quantification of co-expressing cells in the spinal cord. The number of positive cells per segment in the spinal cord was counted at 5 dpf, n = 5 fish for each combination. (F–H) Lateral view of spinal cord showed the co-expression of chrna3tdTomato and chrna5tdTomato, chrna3tdTomato, and chrnb4eGFP, as well as chrnb4eGFP and chrna5tdTomato, co-expressing in the spinal cord (dashed square; arrow, overlapped cell). Scale bars equal 50 µm in (A1)–(C2), 25 µm in (F)–(H), 10 µm in (F1)–(H2). Quantification data show mean values + standard deviation. C, caudal; D, dorsal; M, middle; R, rostral. |