
FIGURE
Fig. 4
- ID
- ZDB-FIG-250207-7
- Publication
- Hua et al., 2025 - Novel Transgenic Zebrafish Lines to Study the CHRNA3-B4-A5 Gene Cluster
- Other Figures
- All Figure Page
- Back to All Figure Page
Fig. 4
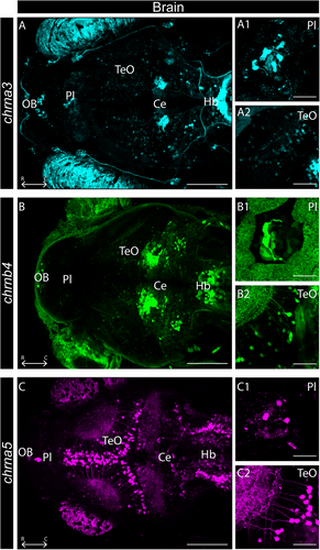
Expression of chrna3tdTomato, chrnb4eGFP, and chrna5tdTomato in the brain at 5 dpf. (A–C) Dorsal view of the expression of chrna3tdTomato, chrnb4eGFP, and chrna5tdTomato in the brain. (A1–C1) dorsal view of the pineal gland (PI). (A2–C2) Dorsal view of the optic tectum (TeO). Scale bars equal 100 µm in (A)–(C), 20 µm in (A1)–(C1). C, caudal; Ce, cerebellum; Hb, hindbrain; OB, olfactory bulb; R, rostral. |
Expression Data
Expression Detail
Antibody Labeling
Phenotype Data
Phenotype Detail
Acknowledgments
This image is the copyrighted work of the attributed author or publisher, and
ZFIN has permission only to display this image to its users.
Additional permissions should be obtained from the applicable author or publisher of the image.
Full text @ Dev. Neurobiol.