
Fig. 7
- ID
- ZDB-FIG-250207-10
- Publication
- Hua et al., 2025 - Novel Transgenic Zebrafish Lines to Study the CHRNA3-B4-A5 Gene Cluster
- Other Figures
- All Figure Page
- Back to All Figure Page
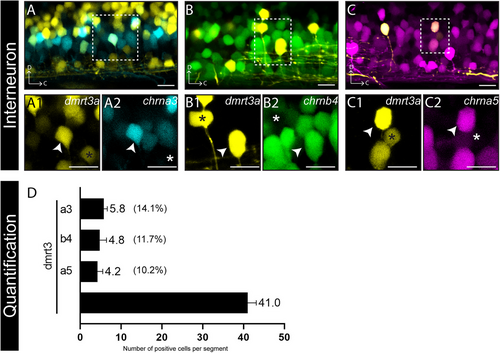
Expression of chrna3tdTomato, chrnb4eGFP, and chrna5tdTomato in dl6 interneurons. (A–C) Lateral view of the chrna3tdTomato, chrnb4eGFP, and chrna5tdTomato positive cells overlapped with dmrt3a expressing cells; dashed box region shown magnified for individual transgenic lines; arrow refers to the overlapped cell; asterisk refers to the interneuron neuron of dmrt3aGFP positive without the expression of chrn-gene. (D) Quantification of positive cells per segment in the spinal cord in chrna3tdTomato, chrnb4eGFP, and chrna5tdTomato crossed with dmrt3aGFP/RFP, n = 5 fish for each transgenic line. Scale bars equal 10 µm in (A)–(C), 25 µm in (A1)–(C2). Quantification data show mean values + standard deviation. C, caudal; D, dorsal. |