
FIGURE
Fig. 4
Fig. 4
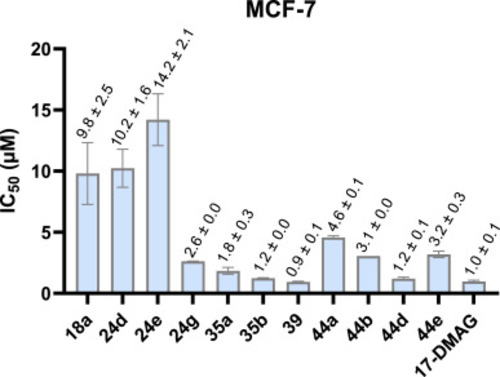
Graphical representation of antiproliferative IC50 values (mean ± SD) determined for all compounds that bind to Hsp90β with Kd values lower than 200 μM in two biological repetitions each performed in triplicate. |
Expression Data
Expression Detail
Antibody Labeling
Phenotype Data
Phenotype Detail
Acknowledgments
This image is the copyrighted work of the attributed author or publisher, and
ZFIN has permission only to display this image to its users.
Additional permissions should be obtained from the applicable author or publisher of the image.
Full text @ Eur. J. Med. Chem.