
Fig. 5
- ID
- ZDB-FIG-241113-9
- Publication
- Jin et al., 2024 - A high-cholesterol zebrafish diet promotes hypercholesterolemia and fasting-associated liver steatosis
- Other Figures
- All Figure Page
- Back to All Figure Page
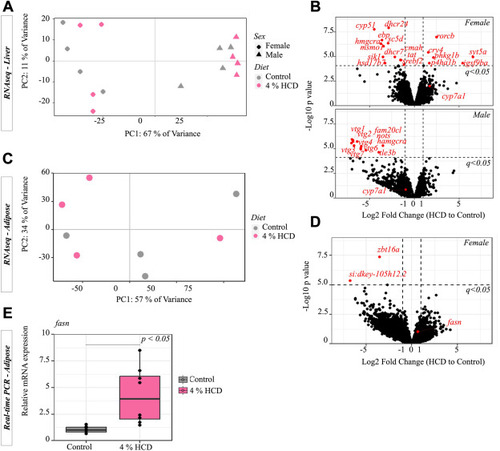
Gene expression analysis on adipose and liver of zebrafish fed 4% HCD and control diet followed by 3 days of fasting. A: Transcriptomic (RNAseq) analysis on the liver of fish fed 4% HCD compared to the control diet. The panel shows the score plot of PCA on log2 count per million (CPM) of the top 500 most variant genes across all 16 fish. B: DEGs (q < 0.05 and |Log2FC| > 1) between the livers of fish of each gender fed 4% HCD compared to the control diet. C: Transcriptomic analysis on the adipose tissue of fish fed 4% HCD compared to the control diet. The panel shows the score plot of PCA across all samples (4 individuals x 2 diets). D: DEGs between the livers of fish fed 4% HCD and the control diet. E: RT-PCR measurement of fasn gene expression (relative to control) in adipose tissue. Each diet group contains 8 individual fish samples (n = 8) collected from two independent experiments (Welch t test). DEGs, differentially expressed genes; HCD, high-cholesterol diet; PCA, principal component analysis. |