
Fig. 3
- ID
- ZDB-FIG-241113-7
- Publication
- Jin et al., 2024 - A high-cholesterol zebrafish diet promotes hypercholesterolemia and fasting-associated liver steatosis
- Other Figures
- All Figure Page
- Back to All Figure Page
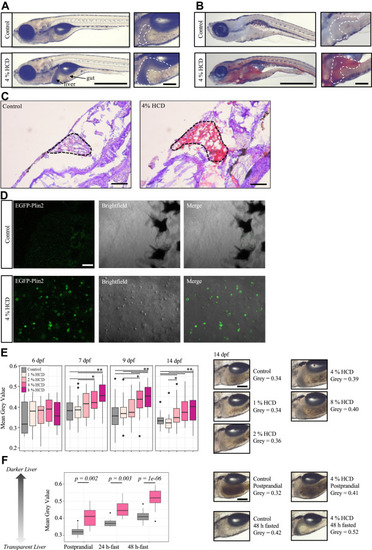
Effect of HCD on liver opacity of zebrafish larvae. A: Representative brightfield image of 14 dpf zebrafish larvae fed the control diet or 4% HCD from 6 dpf to 13 dpf followed by 24 h fasting (n > 20 fish per group). Scale = 1 mm. Scale for zoom image = 0.2 mm. B: Representative Oil-red-O staining image of 14 dpf zebrafish larvae fed the control diet or 4% HCD from 6 dpf to 13 dpf followed by 24 h fasting (n = 38 fish per group). Scale = 1 mm. Scale for zoom image = 0.2 mm. C: Representative Oil-red-O staining on slides of the zebrafish larvae fed the control diet or 4% HCD from 6 dpf to 13 dpf followed by 24 h fasting (n = 5 fish per group). Dotted line shows the liver region of the larvae. Scale = 0.1 mm. D: Confocal images of the liver of EGFP-Plin2 zebrafish, which express EGFP coding sequence fused to the N terminus of the endogenous plin2 gene. Representative images were taken from the livers of 14 dpf fish fed 4% HCD or control diet (n = 4 fish per group). Scale = 10 μm. E: Measurement of liver opacity in postprandial fish (2 h after latest meal) fed control diet, 1%, 2%, 4%, or 8% HCD. Two hundred individuals were used in total. Liver opacity was calculated by measuring the mean gray value of the marked liver area (representative figures shown on the right), which were then normalized by the mean gray value of the muscle area next to the liver. A robust two-way ANOVA with Games-Howell tests was used for statistical test. Details of the method are illustrated in supplemental Fig. S4. Scale = 0.2 mm. F: Effect of fasting on liver opacity. Fish were fed either the control diet (gray) or 4% HCD (pink) from 6 dpf to 13 dpf, followed by either continued feeding or fasting for 24 h or 48 h. Liver opacity was calculated using the same method as D: A robust two-way ANOVA with Games-Howell tests was used for statistical test. Figures of the other two experiments are shown in supplemental Fig. S5. Scale = 0.2 mm. ∗P < 0.05, ∗∗P < 0.001. dpf, days post fertilization; HCD, high-cholesterol diet; Plin2, perilipin 2. |