
Fig. 4
- ID
- ZDB-FIG-241113-8
- Publication
- Jin et al., 2024 - A high-cholesterol zebrafish diet promotes hypercholesterolemia and fasting-associated liver steatosis
- Other Figures
- All Figure Page
- Back to All Figure Page
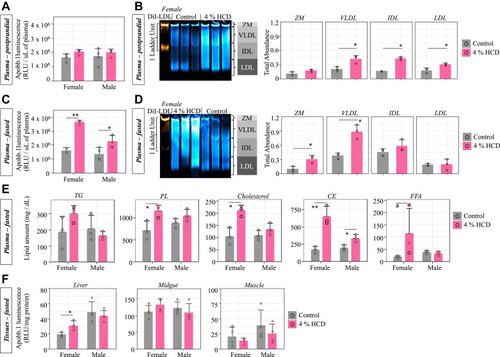
Effect of HCD on plasma ApoB-LP levels and plasma and liver lipids compositions of adult fish. A: LipoGlo-counting for measuring total ApoB-LP in plasma of postprandial fish fed the control diet or 4% HCD for 2 weeks (mean ± SD, two-way ANOVA with Tukey’s post hoc tests). B: The gel figure is LipoGlo-electrophoresis (a Native-PAGE assay to separate the ApoB-LP based on size) on 3 representative female plasmas from each diet (mean ± SD, student t-tests). Image is a composite of chemiluminescent (LipoGlo, blue) and fluorescent (DiI-LDL, orange) exposures. ApoB-LPs are separated into 4 classes based on mobility, including zero mobility (ZM), very-low-density lipoproteins (VLDLs), intermediate-density lipoproteins (IDLs), and low-density lipoprotein (LDL). The ZM fraction is a cluster of species above a certain size threshold, including chylomicrons and chylomicron remnants (21). Gel is a representative image from one of the three independent experiments performed. C: LipoGlo-Counting (mean ± SD, two-way ANOVA with Tukey’s post hoc tests). D: LipoGlo-Electrophoresis (mean ± SD, student t-tests) on plasma samples from fish fed the control diet and 4% HCD, followed by a 3-days fasting period. E: Quantification of major lipid classes in fasted zebrafish plasma using HPLC-CAD platform. A robust two-way ANOVA with Games-Howell tests was used for statistical test. F: LipoGlo-Counting for measuring total ApoB-LP in homogenized liver, gut, or muscle tissues of fasted fish after being fed the control diet or 4% HCD (mean ± SD, robust two-way ANOVA with Games-Howell tests). ∗P < 0.05, ∗∗P < 0.001, #P = 0.07. ApoB, apolipoprotein B; ApoB-LP, ApoB-containing lipoprotein; HCD, high-cholesterol diet. |