
Fig. 2
- ID
- ZDB-FIG-241104-44
- Publication
- da Silva Pescador et al., 2024 - Protein profiling of zebrafish embryos unmasks regulatory layers during early embryogenesis
- Other Figures
- All Figure Page
- Back to All Figure Page
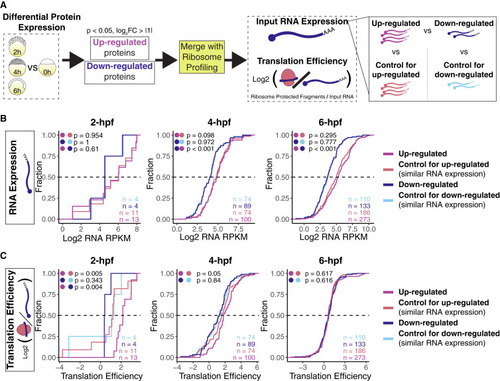
Increase in protein abundance can be explained by translation and higher mRNA expression (A) Diagram for translation efficiency analysis. Proteins were separated as up- or down-regulated, and then the translation efficiency for those encoding mRNA was calculated and compared to groups of genes with similar mRNA expression but unchanged protein levels at each time point. (B and C) Cumulative plots from 2, 4, and 6 h post-fertilization comparing mRNA expression in RPKMs (B) and translation efficiency (C). Colored dots represent statistical tests between groups, and n is the number of genes in each group. When mRNA expression between up- and down-regulated proteins was not statistically different (p > 0.05, Wilcoxon rank-sum test), these groups were compared directly, but when their mRNA expression was different (p < 0.05, Wilcoxon rank-sum test), the groups were compared to their selected controls based on similar mRNA levels. |