
Fig. 1
- ID
- ZDB-FIG-241104-43
- Publication
- da Silva Pescador et al., 2024 - Protein profiling of zebrafish embryos unmasks regulatory layers during early embryogenesis
- Other Figures
- All Figure Page
- Back to All Figure Page
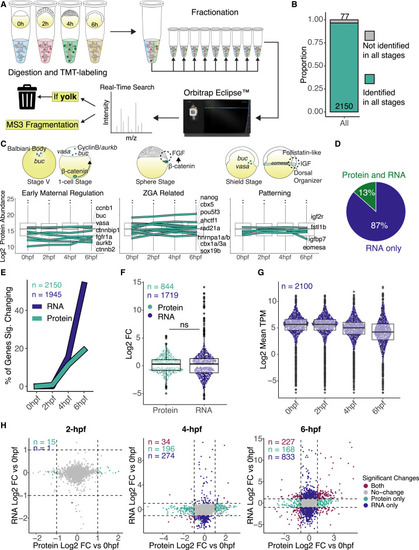
Quantitative proteomic profiles during zebrafish maternal-to-zygotic transition (A) Diagram of mass spectrometry experiment design and analysis. Proteins were extracted and labeled with tandem mass tag (TMT) from four replicates for each time point, fractionated in 9 fractions, and run in an Orbitrap Eclipse instrument. Yolk proteins were added to a contaminants list to be ignored by the instrument during data acquisition. (B) Bar plot represents the proportion of proteins identified in all time points. Proteins that were not quantified in at least 2 replicates or were without Ensembl gene IDs were excluded from further analysis (see Figure S1D). (C) Protein expression plots from previously published early developmental genes in zebrafish. Boxplots represent the log2 of mean protein abundance between the four replicates per time point. Teal lines represent individual gene protein expression over the time course. Cartoons are based on previous publications for localization and temporal expression. (D) Pie chart represents the percentage (%) of identified proteins in relation to all expressing mRNAs in the four time points analyzed. (E) Line graph represents the percentage (%) of significant genes changing at the mRNA (dark blue) and protein (teal line) levels per time point. Significant changes represent fold change (FC) > 2 and adjusted p < 0.05, and n is the number of genes for each type of data, where mRNAs (dark blue) were only accounted for if they were also identified as proteins in our dataset, while only proteins identified in all stages were used. (F) Boxplot comparing the log2FC of significant changing genes for protein (teal) and mRNA (dark blue) at 6 h post-fertilization. Significant changes were considered as FC > 2 and adjusted p < 0.05, and n is the number of significant genes for each type of data. There is no statistical significance between protein and mRNA log2FCs (p = 0.15, Wilcoxon rank-sum test). (G) Boxplot represents the mRNA expression-wide distribution of identified proteins over all time points. n is the number of transcripts expressed as mRNA and identified as proteins. (H) Scatterplot between log2FC in RNA and log2FC in protein levels at each time point compared to 0 hpf. Colored dots represent significant changing genes (log2 FC > |1| and adjusted p < 0.05), and n is the number of genes in each group. |