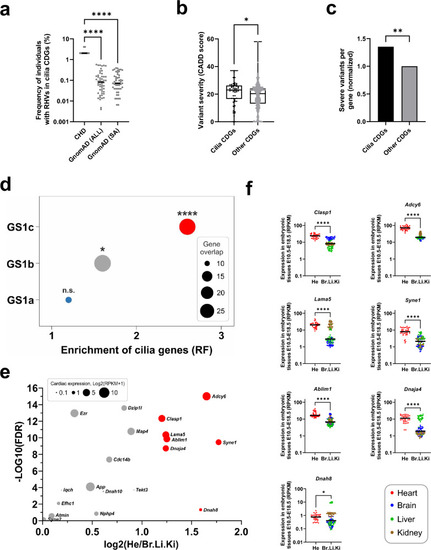
Cilia genes are enriched for rare homozygous variants. a Frequency of individuals with RHVs in 52 cilia CDGs. Frequency per gene in patient cohort (N = 49) was compared with frequency in GnomAD populations. GnomAD (All): Total GnomAD sample (N = 125,748). GnomAD (SA): South Asian GnomAD sub-sample (N = 15,308). Statistic comparison was performed using ANOVA (Kruskal–Wallis test). b Comparison of variant severity of RHVs identified in cilia CDGs (N = 52) and other CDGs (N = 641). Variant severity is indicated as CADD score. Difference between medians were determined using ANOVA (Kruskal–Wallis test). c Normalized comparison of severe RHVs per gene, between cilia CDGs and other CDGs. Severe variants were defined as RHVs with CADD score ≥ 21. Statistical significance of the difference was determined using Fisher’s exact test. d Enrichment of cilia genes among three subsets of GS1. Enrichment was calculated by comparing gene-overlap between CiliaCarta genes (N = 935) and genes within each GS1 subset. Enrichment is shown as representation factor (RF). Hypergeometric statistics was used to test the significance of the overlaps. e Volcano plot of 52 cilia genes showing the differene in gene expression between developing heart (He) and developing brain (Br), Liver (Li) and Kidney (Ki) in mice at E10.5–E18.5 (Cardoso-Moreira et al. 2019). X axis shows the log2 difference between average expression in He and average expression in Br, Li and Ki (only positive values shown). Y axis shows the significance, calculated as –Log10 to the false discovery rate (FDR) (Mann–Whitney U test, adjusted for multiple testing). Significant genes, with log2 difference > 1 is shown with red color. The size of the circle indicate log2 of the average expression of the gene in developing hearts. f Tissue comparative expression of individual genes with fold change > 1. Asterisks indicate P values: *P < 0.05, **P < 0.01, ****P < 0.0001. ns: not significant
|
