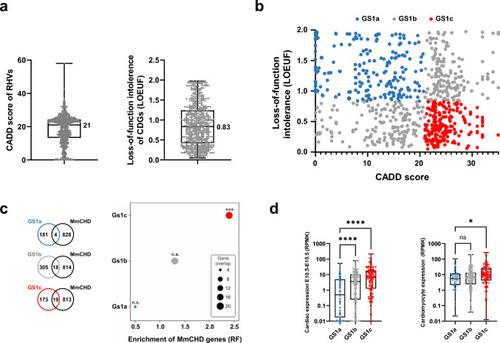
Prioritization of candidate disease genes. a Distribution of CADD scores of RHVs identified in the patients (left) and distribution of loss-of-function intollerence score (LOEUF) in candidate disease genes (CDGs, right). Median values are indicated. b X–Y plot of 678 CDGs containg rare homozygous variants (geneset 1, GS1). The genes are plottet according to CADD score of RHVs identified in each gene (X-axis) and loss-of-function intolerence of the gene (LOEUF, Y-axis). GS1 was divided in three sub-groups. Low-likelihood CDGs (GS1a, blue): CADD < 21, LOEUF > 0.83. Medium likelihood CDGs (GS1b, grey): CADD < 21 and LOEUF ≤ 0.83 or CADD ≥ 21 and LOEUF > 0.83. High-likelihood CDGs (GS1c, red): CADD ≥ 21 and LOEUF ≤ 0.83. c Enrichment of MmCHD genes among three CDG subgroups. Enrichment was calculated by comparing gene-overlap between MmCHD genes and the three sub-groups of GS1. Enrichment is shown as representation factor (RF). A hypergeometric distribution was used to test the significance of the overlaps. d Expression level of the three GS1 subsets in mouse embryonic hearts (left) (Cardoso-Moreira et al. 2019) and in vitro cultures of cardiomyocytes (right) (Wamstad et al. 2012). Difference between medians were determined using ANOVA (Kruskal–Wallis test). Asterisks indicate P values: * P < 0.05, *** P < 0.001, **** P < 0.0001. ns: not significant
|
