
Fig. 8
- ID
- ZDB-FIG-240731-47
- Publication
- Zhou et al., 2024 - Functions of Epimedin C in a zebrafish model of glucocorticoid-induced osteoporosis
- Other Figures
- All Figure Page
- Back to All Figure Page
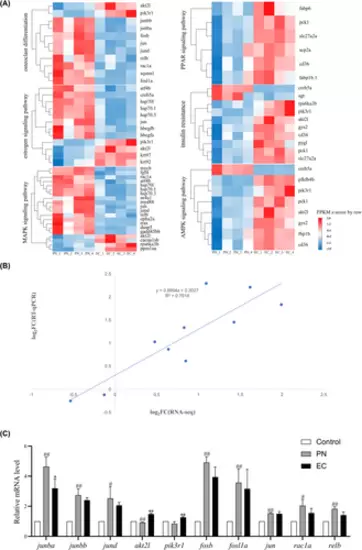
Comprehensive analysis of the key signalling pathways in skeletal development: Expression profiles and transcriptomic verification. (A) Expression heat map of the key signalling pathways related to skeletal development. (B) Verification of transcriptomic data performed by comparing RNA-Seq results with RT-qPCR. Dotted lines and dots represent RNA-Seq and RT-qPCR data, respectively. R2 indicates the correlation strength, with higher values signifying stronger agreement. The X-axis represents the logarithmic (base 2) fold changes in expression levels found using RNA-Seq. The Y-axis indicates the logarithmic (base 2) value of expression level fold change using RT-qPCR. (C) Comparison of the expression of 10 genes using transcriptomic analysis and RT-qPCR (n = 3). Compared with the control group, #p < 0.05, ##p < 0.01. Compared with the 25 μmol/L PN group, *p < 0.05, **p < 0.01. |