
FIGURE
Fig. 7
- ID
- ZDB-FIG-240731-46
- Publication
- Zhou et al., 2024 - Functions of Epimedin C in a zebrafish model of glucocorticoid-induced osteoporosis
- Other Figures
- All Figure Page
- Back to All Figure Page
Fig. 7
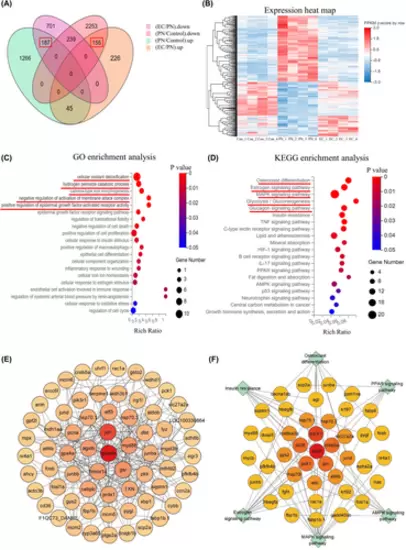
Profile of changes in EC-induced expression. (A) Venn diagram showing reversal of expression in 342 DEGs. (B) Heat map showing reversed expression of DEGs. Heat map showing changes of expression of the 342 DEGs in the control group, 25 μmol/L PN group and 10 μmol/L EC group. (C) GO enrichment scatterplots of the 342 reversed genes. (D) KEGG enrichment analysis scatterplots of the 342 reversed genes. (E) PPIN of 342 reversed genes. (F) PPIN of DEGs enriched in the signalling pathways related to skeletal development. |
Expression Data
Expression Detail
Antibody Labeling
Phenotype Data
Phenotype Detail
Acknowledgments
This image is the copyrighted work of the attributed author or publisher, and
ZFIN has permission only to display this image to its users.
Additional permissions should be obtained from the applicable author or publisher of the image.
Full text @ J. Cell. Mol. Med.