
- Title
-
Functions of Epimedin C in a zebrafish model of glucocorticoid-induced osteoporosis
- Authors
- Zhou, X., Lian, K., Jia, J., Zhao, X., Duan, P., Huang, J., Shi, Y.
- Source
- Full text @ J. Cell. Mol. Med.
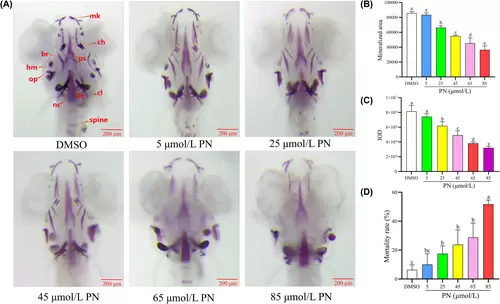
Effect of different concentrations of PN on bone mineralization and bone mass accumulation in the skulls of zebrafish larvae (n = 6). (A) Zebrafish larvae at 9 dpf were treated with different PN concentrations and were stained with alizarin red S. Images show the ventral view of zebrafish skulls. (B) Mineralized area assessed by measuring the areas of the stained skulls. (C) IOD of stained skulls measured using quantitative analysis. (D) Mortality rate of zebrafish larvae increases with increasing PN concentration. br, branchial ray; ch, ceratohyal; cl, cleithrum; hm, hyoid mandibular arch; mk, Meckel's cartilage; nc, notochord; oc, occipital bone; op, operculum; ps, parasphenoid bone. Scale bar: 200 μm. Different letters above the error bars indicate significant differences (p < 0.05) among the groups. |

Effect of different concentrations of EC on bone mineralization and bone mass accumulation in the skulls of zebrafish larvae (n = 6). (A) Zebrafish larvae at 9 dpf were treated with different EC concentrations and were stained with alizarin red S. Images show the ventral view of zebrafish skulls. (B) Mineralized area assessed by measuring the areas of the stained skulls. (C) IOD of the stained skulls measured using quantitative analysis. Scale bar: 200 μm. Different letters above the error bars indicate significant differences (p < 0.05) among the groups. |
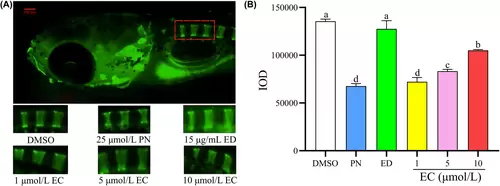
Effect of different concentrations of EC on IOD in zebrafish with GIOP. A zebrafish model of GIOP was established using 25 μmol/L PN. The six exposure groups included a control group, 25 μmol/L PN group, 15 μg/mL ED group and three EC-treatment groups administered the corresponding treatment for 5 days (n = 6). (A) Fluorescence imaging after calcein immersion using fluorescence microscopy. (B) IOD of the one to three vertebral bones of zebrafish in different groups determined using quantitative analysis. Scale bar: 100 μm. Different letters above the error bars indicate significant differences (p < 0.05) among the groups. |

Physiological effects of different EC concentrations in zebrafish larvae. (A) The mortality rate of zebrafish larvae in the three EC-treatment groups (n = 3). (B) The heart rate of zebrafish larvae in the different exposure groups (n = 8). (C) The blood flow of zebrafish larvae in the different exposure groups (n = 10). (D) The blood flow velocity of zebrafish larvae in the different exposure groups (n = 10). Different letters above the error bars indicate significant differences (p <0.05) among the groups. |

Neurobehavioral changes in zebrafish larvae induced by different EC concentrations (n = 4). (A) Representative trajectory traces of 9 dpf zebrafish larvae in six exposure groups for a continuous period of 30 minutes. (B) Total distances moved by 9 dpf zebrafish larvae during the light cycle. (C) Total distances moved by 9 dpf zebrafish larvae during the dark cycle. Different letters above the error bars indicate significant differences (p < 0.05) among the groups. |

GO and KEGG analyses of DEGs in the 25 μmol/L PN group versus the control group, and the 10 μmol/L EC group versus the 25 μmol/L PN group. (A, B) Volcano map of upregulated and downregulated DEGs. (C, D) GO enrichment analysis of upregulated and downregulated DEGs. (E, F) KEGG enrichment of upregulated and downregulated DEGs. The size of the dots represents the number of genes annotated to the KEGG enrichment, and the colour from red to blue represents a significant degree of enrichment. |
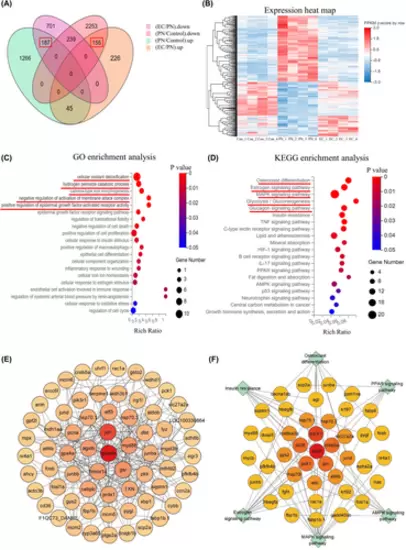
Profile of changes in EC-induced expression. (A) Venn diagram showing reversal of expression in 342 DEGs. (B) Heat map showing reversed expression of DEGs. Heat map showing changes of expression of the 342 DEGs in the control group, 25 μmol/L PN group and 10 μmol/L EC group. (C) GO enrichment scatterplots of the 342 reversed genes. (D) KEGG enrichment analysis scatterplots of the 342 reversed genes. (E) PPIN of 342 reversed genes. (F) PPIN of DEGs enriched in the signalling pathways related to skeletal development. |
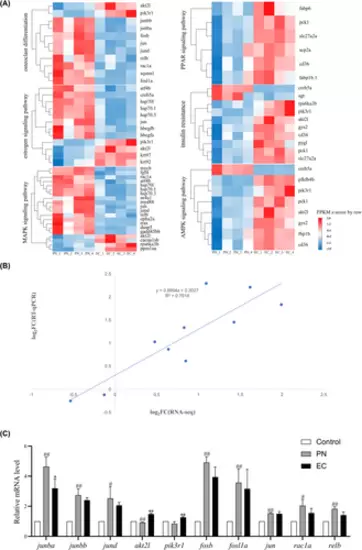
Comprehensive analysis of the key signalling pathways in skeletal development: Expression profiles and transcriptomic verification. (A) Expression heat map of the key signalling pathways related to skeletal development. (B) Verification of transcriptomic data performed by comparing RNA-Seq results with RT-qPCR. Dotted lines and dots represent RNA-Seq and RT-qPCR data, respectively. R2 indicates the correlation strength, with higher values signifying stronger agreement. The X-axis represents the logarithmic (base 2) fold changes in expression levels found using RNA-Seq. The Y-axis indicates the logarithmic (base 2) value of expression level fold change using RT-qPCR. (C) Comparison of the expression of 10 genes using transcriptomic analysis and RT-qPCR (n = 3). Compared with the control group, #p < 0.05, ##p < 0.01. Compared with the 25 μmol/L PN group, *p < 0.05, **p < 0.01. |