
Fig. 3
- ID
- ZDB-FIG-240731-42
- Publication
- Zhou et al., 2024 - Functions of Epimedin C in a zebrafish model of glucocorticoid-induced osteoporosis
- Other Figures
- All Figure Page
- Back to All Figure Page
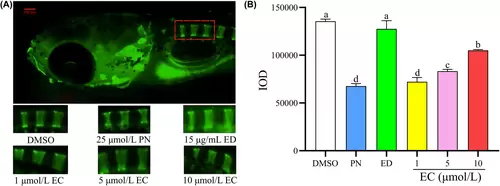
Effect of different concentrations of EC on IOD in zebrafish with GIOP. A zebrafish model of GIOP was established using 25 μmol/L PN. The six exposure groups included a control group, 25 μmol/L PN group, 15 μg/mL ED group and three EC-treatment groups administered the corresponding treatment for 5 days (n = 6). (A) Fluorescence imaging after calcein immersion using fluorescence microscopy. (B) IOD of the one to three vertebral bones of zebrafish in different groups determined using quantitative analysis. Scale bar: 100 μm. Different letters above the error bars indicate significant differences (p < 0.05) among the groups. |