
Fig. 4
- ID
- ZDB-FIG-240729-40
- Publication
- Weiss et al., 2024 - A syngeneic spontaneous zebrafish model of tp53-deficient, EGFRvIII, and PI3KCAH1047R-driven glioblastoma reveals inhibitory roles for inflammation during tumor initiation and relapse in vivo
- Other Figures
- All Figure Page
- Back to All Figure Page
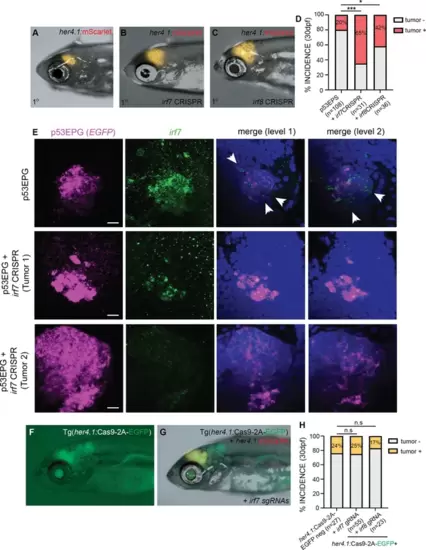
Inflammation-associated irf7 and irf8 inhibit p53EPS formation in vivo. (A–C) Primary (1°) control (A), irf7 CRISPR/Cas9 (B), and irf8 CRISPR/Cas9 (C) injected p53EPS at 30 days post fertilization (dpf). (D) p53EPS incidence at 30 dpf in control (n=3 independent experiments, 108 zebrafish), irf7 CRISPR/Cas9 (***p<0.0001, Fisher’s exact test, n=2 independent experiments, 31 zebrafish), and irf8 CRISPR/Cas9 (*p=0.0155, Fisher’s exact test, n=2 independent experiments, 36 total injected zebrafish). (E) Representative fluorescent in situ hybridization (FISH) images of whole mount control p53EPG (E) EGFRvIII + PI3KCAH1047 + EGFP and p53EPG + irf7 CRISPR/Cas9-injected zebrafish at 8 dpf. p53EPG (EGFP, magenta) and irf7 (green) images represent Z-stack projections through tumor lesions (11 optical sections each). Merged images represent single optical sections at two spatially separated levels within control and irf7 knock-down tumors. DAPI staining (blue) is used to label nuclei. White arrowheads highlight irf7 expression specific to the tumor microenvironment (TME). Scale bars represent 10 μm. (F) Tg(her4.1:Cas9-2A-EGFP) expression at 30 dpf. (G) mScarlet+ p53EPS at 30 dpf in Tg(her4.1:Cas9-2A-EGFP) injected with irf7 guide RNAs (gRNAs) at the one-cell stage. (H) p53EPS incidence at 30 dpf in Tg(her4.1:Cas9-2A-EGFP)-negative gRNA-injected control siblings, and Tg(her4.1:Cas9-2A-EGFP) zebrafish injected at the one-cell stage with irf7 or irf8 gRNAs. n.s. not significant, Fisher’s exact test. |