
Fig. 1
- ID
- ZDB-FIG-240729-31
- Publication
- Weiss et al., 2024 - A syngeneic spontaneous zebrafish model of tp53-deficient, EGFRvIII, and PI3KCAH1047R-driven glioblastoma reveals inhibitory roles for inflammation during tumor initiation and relapse in vivo
- Other Figures
- All Figure Page
- Back to All Figure Page
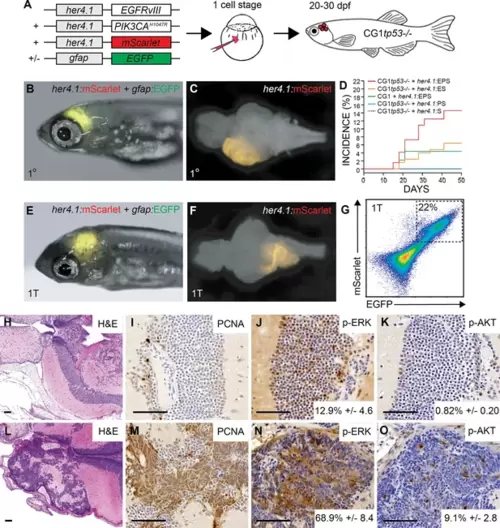
her4.1-driven over-expression of patient-relevant oncogenes drives glial-derived brain tumor formation in syngeneic tp53 loss-of-function mutant zebrafish. (A) Schematic of modeling strategy where linearized transgene vectors with the zebrafish her4.1 promoter driving human EGFRvIII, human PI3KCAH1047R, and mScarlet fluorescent proteins are co-injected at the one-cell stage into syngeneic (CG1 strain) tp53-/- mutant zebrafish embryos. Starting at 15 days post fertilization (dpf), mosaic-injected zebrafish were screened for CNS tumor formation, indicated by mScarlet expression in the brain region of live zebrafish. Co-injection of gfap:GFP linearized transgene is used to assess glial-specific cell fate specification in vivo. (B) her4.1:mScarlet and gfap:GFP expression in the anterior CNS of mosaic-injected syngeneic (CG1 strain) tp53-/- zebrafish at 30 dpf. (C) Whole brain dissected from a p53EPS mosaic-injected zebrafish at 30 dpf. (D) Cumulative frequencies of mScarlet+ CNS lesions in syngeneic tp53-/- mutant (CG1tp53-/-) and wild-type (CG1) zebrafish injected at the one-cell stage with her4.1:EGFRvIII (E), her4.1:PI3KCAH1047R (P), and/or her4.1:mScarlet (S). (E) Syngeneic (CG1 strain) zebrafish at 30 dpf engrafted with her4.1:mScarlet+/gfap:GFP+ brain tumor cells, following primary transplantation (1T) at 2 dpf into the embryonic brain ventricle. (F) Whole brain dissected from engrafted syngeneic host (CG1) zebrafish at 30 dpf. (G) Fluorescence-activated cell sorting (FACS) plot of bulk syngeneic host brain following primary transplant (1T) of her4.1:EGFRvIII + her4.1:PI3KCAH1047R + her4.1:mScarlet + gfap:GFP brain tumor cells. (H–O) Histological staining of uninjected control (H–K) and p53EPS tumor-burdened brains (L–O). (H, L) Hematoxylin and eosin (H&E) staining of coronal sections highlighting telecephalon and diencephalon regions of representative control (H) and p53EPS (L) brains. (I, M) Proliferating cell nuclear antigen (PCNA) staining of control (I) and p53EPS (M) brain sections. (J, N) Phosphorylated-ERK (p-ERK) staining and quantifications reveal increased MAPK signaling pathway activation in p53EPS tumors (p<0.001, n=3 independent tumor sections). (K, O) Phosphorylated-Akt (p-Akt) staining and quantifications reveal increased Akt signaling pathway activity in p53EPS tumors (p=0.007, n=3 independent tumor sections). Scare bars represent 50 μm. |