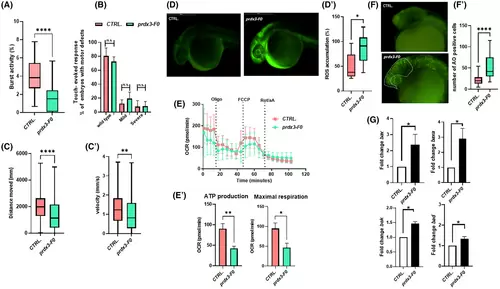
(A) The tail-coiling test results showed a significant decrease in burst activity in prdx3-F0 animals compared with controls (N = 50 per group) (****p ≤ 0.0001, statistics were calculated using the Mann–Whitney U test). (B) Touch-evoked response test analysis showed slightly decreased movement in response to touch stimulus in morphants at 48 hpf compared with controls (statistics were calculated using chi-square tests). (C and C′) Automated analysis of spontaneous motor activity revealed a reduction in swim distance and velocity in mutant F0 larvae at 120 hpf compared with control siblings (N = 200 per group in three independent experiments) (****p < 0.001 and **p < 0.01, statistics were calculated using the Mann–Whitney U test). (D) Representative fluorescence images of ROS generation in zebrafish larvae at 30 hpf (N = 30 per group). (D′) Graphs show the quantitative analysis of fluorescent signals. (*p < 0.05, statistics were calculated using the Mann–Whitney U test). (E and E′) Mitochondrial respiratory analysis of controls (N = 20) and mutant F0 larvae (N = 20) at 120 hpf (*p < 0.05 and **p < 0.01, statistics were calculated using the Mann–Whitney U test). (F and F′) Representative fluorescence images showing the presence, visible to the naked eye, of AO-positive cells in controls and mutant F0 embryos at 30 hpf (lateral views). AO-positive cells were counted in the area defined by the yellow line (****p < 0.001, statistics were calculated using the Mann–Whitney U test). (G) qRT-PCR analysis revealed increases in apoptosis-related gene expression, once the mRNA expression levels had been normalized to β-Actin. Three independent RNA samples from controls and prdx3-F0 larvae at 120 hpf were analyzed (*p ≤ 0.05, statistics were calculated using Student's t-test). AO, acridine orange; N, number of evaluated embryos in total; n.s., not significant; OCR, oxygen consumption rate; ROS, reactive oxygen species. Error bars indicate standard error of the mean.
|
