
- Title
-
SCAR32: Functional characterization and expansion of the clinical-genetic spectrum
- Authors
- Naef, V., Lieto, M., Satolli, S., De Micco, R., Troisi, M., Pasquariello, R., Doccini, S., Privitera, F., Filla, A., Tessitore, A., Santorelli, F.M.
- Source
- Full text @ Ann Clin Transl Neurol
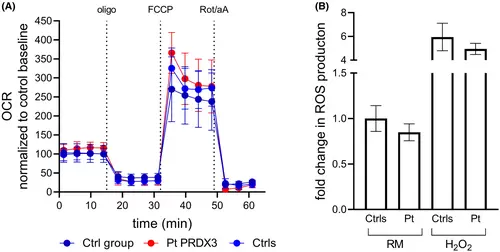
(A) Kinetic micro-oxygraphy graph depicting mean ± SD of OCR values generated using the XFe24 analyzer (Seahorse Biosciences) under basal conditions and in response to the indicated drugs. Metabolic parameters obtained from OCR traces did not show significant changes in mitochondrial function between the patient and the controls. Data (Ctrls: five replicates from three different control cell lines; Pt PRDX3: 10 replicates from the patient cell line; Ctrl group: data (obtained from 31 previously tested control lines) were expressed as pmol O2/minute and normalized post assay to Hoechst 33342 intensity, as a function of the number of cells. Micro-oxygraph traces were further normalized as percent of control baseline. Oligo: 2-μM oligomycin; FCCP: 2-μM carbonyl cyanide 4-(trifluoromethoxy) phenylhydrazone; Rot/aA: 0.5/0.5-μM rotenone/antimycin A. OCR, oxygen consumption rate. (B) Evaluation of susceptibility to oxidative stress in patient fibroblasts under both regular medium (RM) and stress conditions. Data represent mean ± SD of controls (n = 3) and the patient analyzed in technical triplicate. Statistical analysis performed by ordinary ANOVA test (one-way ANOVA) did not show significant differences between patient and controls. |
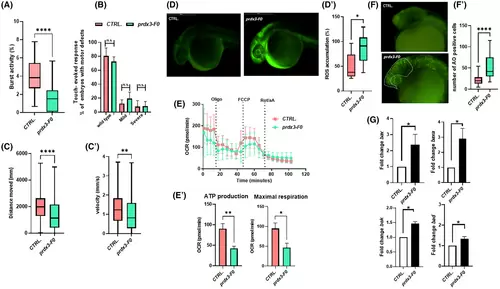
(A) The tail-coiling test results showed a significant decrease in burst activity in prdx3-F0 animals compared with controls (N = 50 per group) (****p ≤ 0.0001, statistics were calculated using the Mann–Whitney U test). (B) Touch-evoked response test analysis showed slightly decreased movement in response to touch stimulus in morphants at 48 hpf compared with controls (statistics were calculated using chi-square tests). (C and C′) Automated analysis of spontaneous motor activity revealed a reduction in swim distance and velocity in mutant F0 larvae at 120 hpf compared with control siblings (N = 200 per group in three independent experiments) (****p < 0.001 and **p < 0.01, statistics were calculated using the Mann–Whitney U test). (D) Representative fluorescence images of ROS generation in zebrafish larvae at 30 hpf (N = 30 per group). (D′) Graphs show the quantitative analysis of fluorescent signals. (*p < 0.05, statistics were calculated using the Mann–Whitney U test). (E and E′) Mitochondrial respiratory analysis of controls (N = 20) and mutant F0 larvae (N = 20) at 120 hpf (*p < 0.05 and **p < 0.01, statistics were calculated using the Mann–Whitney U test). (F and F′) Representative fluorescence images showing the presence, visible to the naked eye, of AO-positive cells in controls and mutant F0 embryos at 30 hpf (lateral views). AO-positive cells were counted in the area defined by the yellow line (****p < 0.001, statistics were calculated using the Mann–Whitney U test). (G) qRT-PCR analysis revealed increases in apoptosis-related gene expression, once the mRNA expression levels had been normalized to β-Actin. Three independent RNA samples from controls and prdx3-F0 larvae at 120 hpf were analyzed (*p ≤ 0.05, statistics were calculated using Student's t-test). AO, acridine orange; N, number of evaluated embryos in total; n.s., not significant; OCR, oxygen consumption rate; ROS, reactive oxygen species. Error bars indicate standard error of the mean. |