
Fig. 1
- ID
- ZDB-FIG-240717-9
- Publication
- Naef et al., 2024 - SCAR32: Functional characterization and expansion of the clinical-genetic spectrum
- Other Figures
- All Figure Page
- Back to All Figure Page
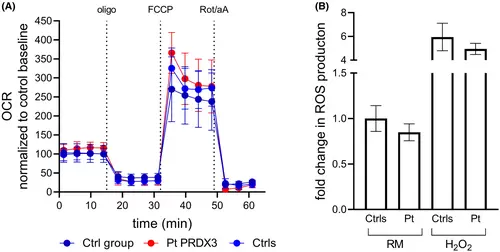
(A) Kinetic micro-oxygraphy graph depicting mean ± SD of OCR values generated using the XFe24 analyzer (Seahorse Biosciences) under basal conditions and in response to the indicated drugs. Metabolic parameters obtained from OCR traces did not show significant changes in mitochondrial function between the patient and the controls. Data (Ctrls: five replicates from three different control cell lines; Pt PRDX3: 10 replicates from the patient cell line; Ctrl group: data (obtained from 31 previously tested control lines) were expressed as pmol O2/minute and normalized post assay to Hoechst 33342 intensity, as a function of the number of cells. Micro-oxygraph traces were further normalized as percent of control baseline. Oligo: 2-μM oligomycin; FCCP: 2-μM carbonyl cyanide 4-(trifluoromethoxy) phenylhydrazone; Rot/aA: 0.5/0.5-μM rotenone/antimycin A. OCR, oxygen consumption rate. (B) Evaluation of susceptibility to oxidative stress in patient fibroblasts under both regular medium (RM) and stress conditions. Data represent mean ± SD of controls (n = 3) and the patient analyzed in technical triplicate. Statistical analysis performed by ordinary ANOVA test (one-way ANOVA) did not show significant differences between patient and controls. |