|
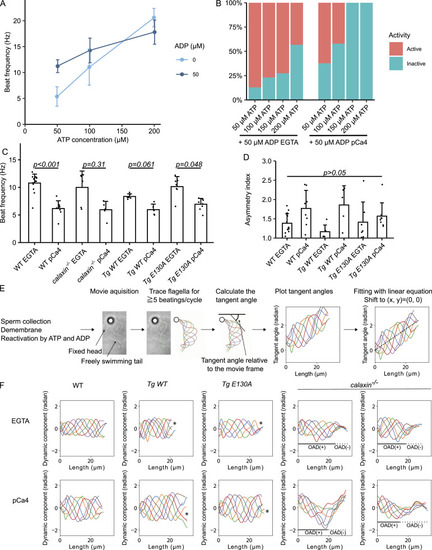
Sperm model reconstituted flagellar beating. (A) Comparison of sperm model beat frequencies between different ATP and ADP concentrations under the presence of 0.1 mM EGTA. A higher ATP concentration led to a faster beating frequency, and the supplementation of ADP reduced the variation of beating frequencies. n = 26 (50 μM ATP), 22 (100 μM ATP), 18 (200 μM ATP), 37 (50 μM ATP + 50 μM ADP), 39 (100 μM ATP + 50 μM ADP), 26 (200 μM ATP + 50 μM ADP). (B) Activation rates of sperm model under different ATP concentrations with 50 μM ADP. An ATP concentration higher than 50 μM lowered the activation rate, especially in the presence of calcium. Under the pCa4 condition, 150 μM or higher ATP + 50 μM ADP did not reactivate the sperm model. N = 193 (50 μM ATP + 50 μM ADP + EGTA), 355 (100 μM ATP + 50 μM ADP + EGTA), 171 (150 μM ATP + 50 μM ADP + EGTA), 194 (200 μM ATP + 50 μM ADP + EGTA), 265 (50 μM ATP + 50 μM ADP + pCa4), 145 (100 μM ATP + 50 μM ADP + pCa4), 63 (150 μM ATP + 50 μM ADP + pCa4), and 30 (200 μM ATP + 50 μM ADP + pCa4). (C) Beat frequencies of WT, calaxin−/−, Tg WT, and Tg E130A sperm models under the presence of 0.1 mM EGTA (EGTA) or CaCl2 (pCa4). Sperm showed a slower beating under the presence of calcium, although the difference was not significant in calaxin−/− and Tg WT. All data are shown with a mean (bar graphs) + SE (error bars). All data were collected from n = 14 (WT EGTA), 8 (WT, pCa4), 6 (calaxin−/− EGTA), 5 (calaxin−/− pCa4), 6 (Tg WT EGTA), 5 (Tg WT pCa4), 7 (Tg E130A EGTA), and 8 (Tg E130A pCa4) sperm flagella from two or more independent experiments. (D) Comparison of asymmetry indices of WT, Tg WT, and Tg E130A sperm flagella. The trend was similar to the basal curvature shown in Fig 3E; however, it did not reach statistical significance. All data are shown with a mean (bar graphs) + SE (error bars). All data were collected from n = 14 (WT EGTA), 8 (WT, pCa4), 6 (Tg WT EGTA), 5 (Tg WT pCa4), 7 (Tg E130A EGTA), and 8 (Tg E130A pCa4) sperm flagella from two or more independent experiments. (E) Schematic illustration of the waveform analysis. Demembranated sperm flagella were reactivated, recorded, and traced. The tangent angle was defined as the angle between the tangent line (dotted line) and the horizontal axis of the image (black line). The tangent angles from ≧5 beatings/cycle were plotted and fitted with linear equations. The dotted black line in the rightmost panel shows the fitted linear equation. Basal curvature was defined as its slope. The tangent angle plot is shifted so that the equation starts from (x, y) = (0, 0). (F) Dynamic components of sperm waveforms shown in Fig 3A–D. To obtain the dynamic component, the fitted equation (the static component) was subtracted from each tangent angle plot. Under the pCa4 condition, calaxin−/− sperm showed skewed plots, indicating the biphasic waveform consisting of the proximal region with weaker asymmetry and the distal region with higher asymmetry. Other plots showed symmetric, sinusoidal paths, proving that the dynamic and static components are successfully separated.
|