FIGURE SUMMARY
Title

Calaxin is a key factor for calcium-dependent waveform control in zebrafish sperm

Authors
Morikawa, M., Yamaguchi, H., Kikkawa, M.
Source
Full text @ Life Sci Alliance

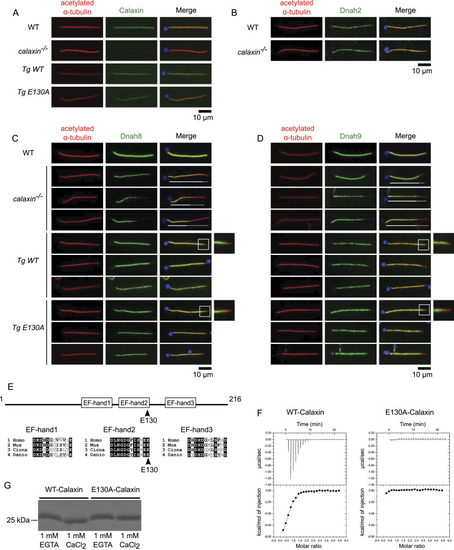
Calaxin calcium-binding activity is dispensable to stabilize outer arm dynein (OAD).

(A, B, C, D) Immunofluorescence of WT, calaxin−/−, Tg(actb2:calaxin);calaxin−/−(Tg WT), and Tg(actb2:calaxin_E130A);calaxin−/−(Tg E130A) sperm. Sperm were stained with anti-Calaxin (A), Dnah2 (B), Dnah8 (C), or Dnah9 (D) antibodies (green) and costained with DAPI (blue) and acetylated α-tubulin (red). Scale bars, 10 μm. (A)calaxin−/− sperm flagella did not contain Calaxin, whereas Tg WT and Tg E130A restored this phenotype. (B)calaxin−/− sperm flagella contained Dnah2 as in WT. (C, D)calaxin−/− sperm flagella lacked Dnah8 and Dnah9 on their distal half, whereas WT sperm contained them along the whole length of the axoneme. The amount of Dnah8 and Dnah9 was variable between calaxin−/− flagella. White lines and dotted lines show OAD(+) and OAD(−) regions, respectively. Tg WT and Tg E130A contained Dnah8 and Dnah9 along the length of the axoneme except for distal tips (white boxes), almost restoring the phenotype of the calaxin−/− mutant. The magnified images of distal tips (white boxes) are also shown on the right. (E) Domain structure of Calaxin (top) and multiple alignments of three EF-hand calcium-binding regions (bottom). E130 (arrowheads) is the last residue of the EF-hand2, which is the most highly conserved between Homo sapiens, Mus musculus, Ciona intestinalis, and Danio rerio. (F) Isothermal titration calorimetry of recombinant WT-Calaxin (left) and E130A-Calaxin (right). Three sequential binding site models were used for fitting. WT bound to three calcium ions per molecule, whereas E130A showed no binding. (G) SDS–PAGE of recombinant WT-Calaxin and E130A-Calaxin with 1 mM EGTA or CaCl2. WT-Calaxin showed higher mobility in 1 mM CaCl2 compared with 1 mM EGTA, whereas E130A-Calaxin showed a slight difference.

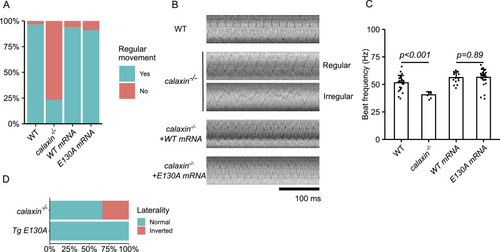
Calaxin calcium-binding activity is dispensable for KV ciliary movement.

(A) Classification of KV cilia. KV cilia of WT embryos, calaxin−/− embryos, and calaxin−/− embryos injected with calaxin WT (WT mRNA) or E130A mRNA (E130A mRNA) were recorded by a bright-field microscope (AF6000B; Leica) equipped with a high-speed camera (HAS-L1; DITECT) at 1,000 fps at the 8–10 somite stage. KV ciliary motility was classified into normal conically rotating movement and abnormal movement, including irregular movement and quiescence. Both WT and E130A mRNA restored the irregular movement of calaxin−/− KV cilia. All data were collected from n = 30 cilia from 6 embryos (WT), 30 cilia from 5 embryos (calaxin−/−), 17 cilia from 3 embryos (WT mRNA), and 33 cilia from 4 embryos (E130A mRNA). (B) Kymographs of KV cilia. Normal regularly rotating cilia from WT, calaxin−/−, and calaxin−/− injected with WT or E130A mRNA embryos and an irregularly moving cilium from calaxin−/− embryo are shown. (C) Beat frequencies of KV cilia. Normal conically rotating cilia shown in (A) were subjected to the analysis. calaxin−/− cilia showed a slower beating frequency. Both calaxin WT and E130A mRNA injected into calaxin−/− embryo restored the motility to the same extent. All data are shown with a mean (bar graphs) + SE (error bars). Scale bar, 100 ms. n = 29 cilia from 6 embryos (WT), seven cilia from 3 embryos (calaxin−/−), 16 cilia from 3 embryos (calaxin−/− + WT mRNA), and 30 cilia from 4 embryos (calaxin−/− + E130A mRNA). (D) Laterality of the calaxin−/− and Tg E130A embryos. calaxin−/− and Tg E130A adults were crossed to obtain embryos. The direction of the heart looping was observed at the 30–33 hpf stage to determine the laterality, followed by genotyping. calaxin−/− embryos exhibited laterality randomization as observed before, whereas Tg E130A showed normal laterality. n = 12 embryos for each genotype.

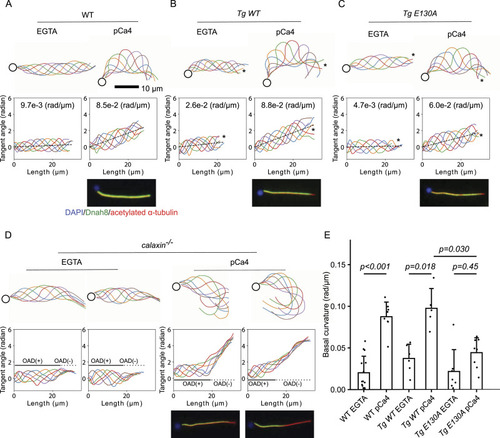
Calaxin calcium-binding activity is necessary for the calcium-induced asymmetric beating of sperm.

(A, B, C, D) Traces (top) and tangent angle plots (bottom) of WT (A), Tg WT (B), Tg E130A (C), and calaxin−/− (D) demembranated sperm models under the presence of 0.1 mM EGTA (EGTA) or CaCl2 (pCa4). Immunofluorescence microscopy results from Fig 1C are also shown for the comparison. WT and Tg WT showed an almost symmetric waveform in the EGTA condition, and the pCa4 condition induced asymmetric waveform. Tg E130A showed a similar waveform in the EGTA condition, but the pCa4 condition induced weaker asymmetry compared with WT and Tg WT. calaxin−/− sperm model had an active proximal region and an inactive distal region. The inactive distal region exhibited a highly curved waveform in the pCa4 condition. (A, B, C) Calculated basal curvatures are shown in tangent angle plots. (B, C) Asterisks indicate distal ends of flagella that lack an outer arm dynein (OAD). (D) Black lines and dotted lines show estimated OAD(+) and OAD(−) regions, respectively. (E) Comparison of basal curvatures of WT, Tg WT, and Tg E130A sperm flagella. The pCa4 condition induced significantly higher basal curvature in both WT and Tg WT, but Tg E130A did not show a significant elevation of basal curvature. In addition, the basal curvature of Tg E130A was significantly lower than that of Tg WT in the pCa4 condition. All data are shown with a mean (bar graphs) + SE (error bars). All data were collected from n = 14 (WT EGTA), 8 (WT, pCa4), 6 (Tg WT EGTA), 5 (Tg WT pCa4), 7 (Tg E130A EGTA), and 8 (Tg E130A pCa4) sperm flagella from two or more independent experiments.

Recombinant WT- and E130A-Calaxin can bind to a Calaxin-deficient outer arm dynein (OAD).

Immunofluorescence of sperm flagella from WT, calaxin−/−, and armc4−/− zebrafish supplemented with recombinant proteins. Scale bar, 10 μm. (A) Sperm flagella with BSA as a control. Compared with WT, calaxin−/− lacked OAD Dnah8 in the distal region (arrowheads) and completely lost Calaxin (asterisks) as in Fig 1C. Armc4−/− completely lacked both Dnah8 and Armc4 (asterisks). (B) Sperm flagella with BSA and WT-Calaxin. Calaxin localized to the proximal Dnah8(+) region in calaxin−/− (arrowheads), but it did not bind to armc4−/− sperm flagella (asterisks). (C) Sperm flagella with BSA and E130A-Calaxin. E130A-Calaxin showed an identical localization pattern as WT-Calaxin in (B). It colocalized with Dnah8 in calaxin−/− (arrowheads), but it did not localize to armc4−/− sperm flagella (asterisks).

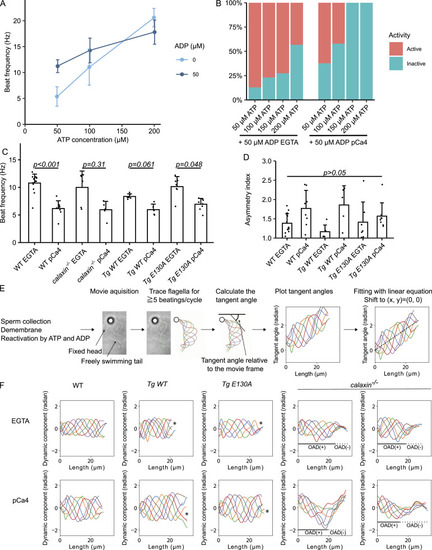
Sperm model reconstituted flagellar beating.

(A) Comparison of sperm model beat frequencies between different ATP and ADP concentrations under the presence of 0.1 mM EGTA. A higher ATP concentration led to a faster beating frequency, and the supplementation of ADP reduced the variation of beating frequencies. n = 26 (50 μM ATP), 22 (100 μM ATP), 18 (200 μM ATP), 37 (50 μM ATP + 50 μM ADP), 39 (100 μM ATP + 50 μM ADP), 26 (200 μM ATP + 50 μM ADP). (B) Activation rates of sperm model under different ATP concentrations with 50 μM ADP. An ATP concentration higher than 50 μM lowered the activation rate, especially in the presence of calcium. Under the pCa4 condition, 150 μM or higher ATP + 50 μM ADP did not reactivate the sperm model. N = 193 (50 μM ATP + 50 μM ADP + EGTA), 355 (100 μM ATP + 50 μM ADP + EGTA), 171 (150 μM ATP + 50 μM ADP + EGTA), 194 (200 μM ATP + 50 μM ADP + EGTA), 265 (50 μM ATP + 50 μM ADP + pCa4), 145 (100 μM ATP + 50 μM ADP + pCa4), 63 (150 μM ATP + 50 μM ADP + pCa4), and 30 (200 μM ATP + 50 μM ADP + pCa4). (C) Beat frequencies of WT, calaxin−/−, Tg WT, and Tg E130A sperm models under the presence of 0.1 mM EGTA (EGTA) or CaCl2 (pCa4). Sperm showed a slower beating under the presence of calcium, although the difference was not significant in calaxin−/− and Tg WT. All data are shown with a mean (bar graphs) + SE (error bars). All data were collected from n = 14 (WT EGTA), 8 (WT, pCa4), 6 (calaxin−/− EGTA), 5 (calaxin−/− pCa4), 6 (Tg WT EGTA), 5 (Tg WT pCa4), 7 (Tg E130A EGTA), and 8 (Tg E130A pCa4) sperm flagella from two or more independent experiments. (D) Comparison of asymmetry indices of WT, Tg WT, and Tg E130A sperm flagella. The trend was similar to the basal curvature shown in Fig 3E; however, it did not reach statistical significance. All data are shown with a mean (bar graphs) + SE (error bars). All data were collected from n = 14 (WT EGTA), 8 (WT, pCa4), 6 (Tg WT EGTA), 5 (Tg WT pCa4), 7 (Tg E130A EGTA), and 8 (Tg E130A pCa4) sperm flagella from two or more independent experiments. (E) Schematic illustration of the waveform analysis. Demembranated sperm flagella were reactivated, recorded, and traced. The tangent angle was defined as the angle between the tangent line (dotted line) and the horizontal axis of the image (black line). The tangent angles from ≧5 beatings/cycle were plotted and fitted with linear equations. The dotted black line in the rightmost panel shows the fitted linear equation. Basal curvature was defined as its slope. The tangent angle plot is shifted so that the equation starts from (x, y) = (0, 0). (F) Dynamic components of sperm waveforms shown in Fig 3A–D. To obtain the dynamic component, the fitted equation (the static component) was subtracted from each tangent angle plot. Under the pCa4 condition, calaxin−/− sperm showed skewed plots, indicating the biphasic waveform consisting of the proximal region with weaker asymmetry and the distal region with higher asymmetry. Other plots showed symmetric, sinusoidal paths, proving that the dynamic and static components are successfully separated.

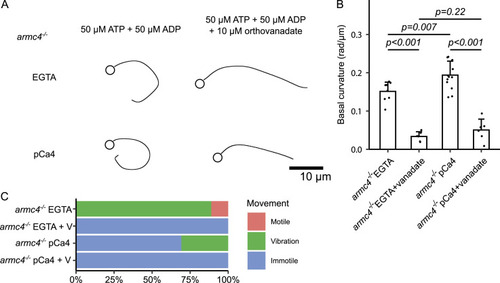
Calcium increased the asymmetry of armc4−/− sperm model flagella.

(A) Traces of armc4−/− sperm reactivated with ATP + ADP under EGTA or pCa4 conditions with or without 10 μM sodium orthovanadate. ATP + ADP induced highly curved flagella, which were relaxed by the addition of orthovanadate. Scale bar, 10 μm. (B) Quantification of armc4−/− sperm flagellar curvature. For immotile or irregularly vibrating sperm, one frame per flagellum was traced. Under both EGTA and pCa4 conditions, ATP + ADP induced higher curvature, and dynein ATPase inhibitor orthovanadate significantly reduced the curvature. The pCa4 condition led to higher curvature compared with the EGTA condition when activated by ATP + ADP. All data are shown with a mean (bar graphs) + SE (error bars). (C) Classification of armc4−/− sperm model motility. Most of the armc4−/− sperm models showed irregular, vibrating movement or were immotile. Orthovanadate (EGTA + V and pCa4 + V) completely stopped their motility. (B, C) All data were collected from n = 9 (armc4−/− EGTA), 6 (armc4−/− EGTA + vanadate), 13 (armc4−/− pCa4), and 6 (armc4−/− pCa4 + vanadate) sperm flagella.

Acknowledgments
This image is the copyrighted work of the attributed author or publisher, and ZFIN has permission only to display this image to its users. Additional permissions should be obtained from the applicable author or publisher of the image. Full text @ Life Sci Alliance