
Fig. 10
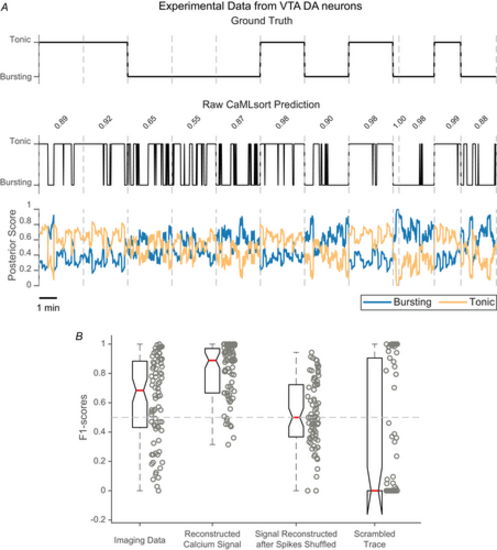
CAMLSORT PREDICTIONS OF CELLULAR STATE FROM CALCIUM SIGNALS OF VTA DA NEURONS A, a subset of 12 (of 78) raw CaMLsort predictions from imaging data acquired from DA neurons of the VTA in mice. Each prediction was independently obtained but has been stitched together to produce a single time series with cells separated by vertical dashed lines. The ground truth state (top) is used as reference to assess the quality of CaMLsort's predictions (middle) using the F1 score, which is printed above the prediction for each cell. The posterior scores for each class, bursting (blue) and tonic (light orange), are shown in the lowest plot. B, the entire distribution of F1 scores (n = 78) between the ground truth state and the binary classification from CaMLsort obtained from various inputs: (from left to right) experimentally-acquired ΔF/F traces, calcium signals reconstructed from true spike trains using the GCaMP5G kernel, calcium signals reconstructed from shuffled spike trains using the GCaMP5G kernel or a scrambled version of the raw ΔF/F data. Individual datapoints are shown alongside each boxplot. The horizontal dashed line corresponds to an F1 score of 0.5. The notches indicate 95% confidence intervals around the median (red line). |