
Fig. 1
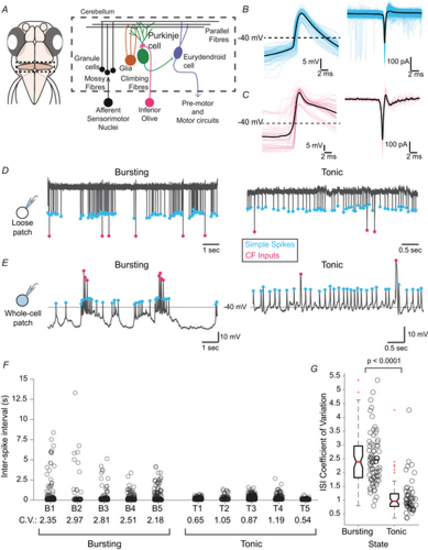
CEREBELLAR PNS IN LARVAL ZEBRAFISH EXHIBIT MEMBRANE POTENTIAL BISTABILITY A, schematic of the cerebellar circuitry in larval zebrafish (Danio rerio), showing the location of the cerebellum in the brain (left, dashed line box) and the cell types and circuit architecture (right). PNs (green) are the principal neurons in this circuit and receive multiple inputs from afferent sensorimotor nuclei outside the cerebellum via parallel fibres (black) and climbing fibres (magenta). B, simple spikes, as observed intracellularly (left) and extracellularly (right). Individual events (n = 100, intracellular and n = 100, extracellular) are shown in cyan and have been aligned and superimposed on one another. The average of these events is shown in black. C, climbing fibre (CF) inputs, as observed intracellularly (left) and extracellularly (right). Individual events (n = 55 intracellular and n = 10 extracellular) are shown in magenta, and their respective averages in black. D, representative loose patch recordings from larval zebrafish PNs showing the two modes of firing. The bursting mode recording is shown on the left, and the tonic mode is shown on the right. In each mode, electrical events can be distinguished by their amplitude, with small-amplitude simple spikes marked in cyan and the large-amplitude CF inputs marked in magenta. E, representative whole-cell current clamp recordings showing the two modes of firing in PNs, with the same colour scheme for events as before. Cells shown in (D) and (E) are different. F, example plots of simple spike inter-event intervals from individual recordings. Five example cells are shown from each class (Bursting and Tonic). The coefficient of variation of this distribution is marked under each cell as ‘C.V.’. G, the distribution of interspike interval coefficients of variation (n = 131 cells), sorted by state (n = 53 for tonic, and n = 78 for bursting). The distributions are significantly different, tested using a Mann–Whitney U test (P = 6.0733e-16). |