
Fig. 9
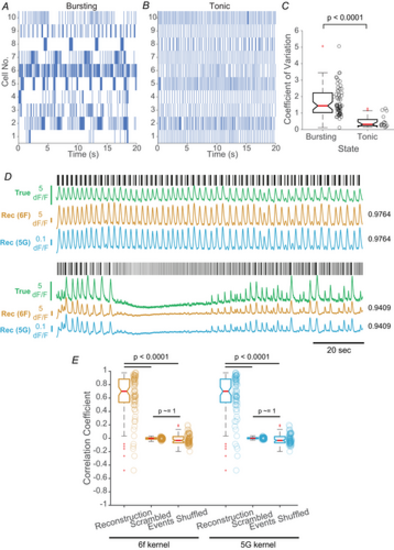
RECONSTRUCTING CALCIUM SIGNALS FOR VTA DA NEURONS USING A CONVOLUTION-BASED FORWARD MODEL A and B, spike rasters of two representative VTA DA neurons. C, the distributions of C.V.s of interspike intervals for cells classified as either bursting (n = 62) or tonic (n = 16 cells). The P value was calculated using a one-sided Mann–Whitney U test. D, electrophysiological activity and associated calcium signals from two representative VTA DA neurons. For each cell, spike timings are shown as rasters (black) and the raw simultaneously-acquired ΔF/F signals aligned below (green). Two calcium signal reconstructions were generated, using either a GCaMP6f kernel (gold) or a GCaMP5G kernel (blue). Numbers alongside each reconstruction indicate the Pearson correlation coefficient between the ground truth and the corresponding calcium signal reconstruction. E, quantification of the reconstruction quality, as measured using the Pearson correlation coefficient between the ground truth and reconstructed signals (‘Reconstruction’). For each cell (n = 78), the correlation between ground truth and a scrambled version of the reconstructed signal (‘Scrambled’), as well as the correlation between ground truth and a reconstruction generated after shuffling spike timings (‘Events Shuffled’), were measured. Individual data points are plotted alongside each boxplot. P values were calculated using a Kruskal–Wallis test and yielded a P value of 4.6130 × 10−49, and then using the post hoc Dunn's test for individual comparisons, the latter of which are indicated. |