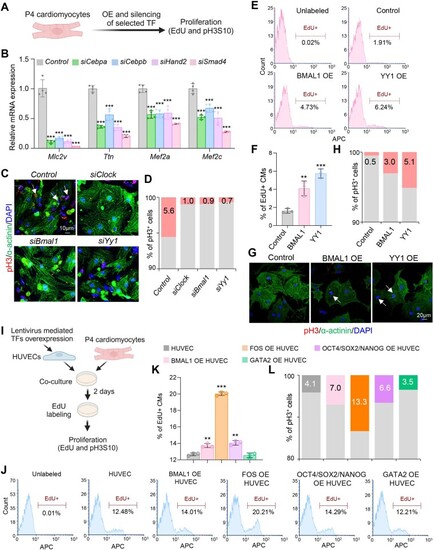
Functions of identified TFs in CM dedifferentiation and proliferation. (A) Schematic representation of the experimental setup for A–H. (B) Real-time PCR analysis of CM marker genes in P4 CMs after TF silencing. n = 4 biological replicates. (C, D) Representative immunostainings for the mitotic marker phospho-histone H3 (pH3S10) (red), α-actinin (green) and DAPI (blue) of P4 CMs, after siRNA mediated silencing of the indicated in the figure TFs (C) and quantification of pH3+ CMs (D). 200–300 cells were quantified in D. Arrows indicate pH3-positive (pH3+) cells. Scale bar: 10 μm. (E, F) Representative histograms showing FACS analysis of EdU+ cells after overexpression of human BMAL1 and YY1 in P4 CMs (E) and quantification of the percentage of EdU + CMs (F). n = 3 biological replicates. (G, H) Representative immunostainings of control, BMAL11 or YY1 overexpressing P4 CMs for the mitotic marker pH3S10 (red), α-actinin (green) and DAPI (blue) (G) and quantification of pH3+ CMs (H). 200–300 cells were quantified. Arrows indicate pH3+CMs cells. Scale bar: 10 μm. (I) Schematic representation of the co-culture of P4 CMs with HUVECs overexpressing control construct or human BMAL1, FOS, GATA2 alone, or OCT4, SOX2 and NANOG in combination, followed by subsequent analysis. (J, K) Representative histograms showing FACS analysis of EdU+ P4 CMs after 48 hours of co-culture with HUVECs overexpressing the indicated in the figure TFs (J) and quantification of the percentage of EdU+ CMs (K). n = 3 biological replicates. (L) Quantification of pH3 + P4 CMs after 48 h of co-culture with HUVECs overexpressing the indicated in the figure TFs. 200–300 cells were quantified. Data are presented as mean ± SD. Differences between groups were assessed using an unpaired two-tailed Student's t-test. *P< 0.05, **P< 0.01, ***P< 0.001.
|
