FIGURE

Figure 4.

ID
ZDB-FIG-240509-74
Publication
Cordero et al., 2024 - Leveraging chromatin state transitions for the identification of regulatory networks orchestrating heart regeneration
Other Figures
All Figure Page
Back to All Figure Page
Figure 4.

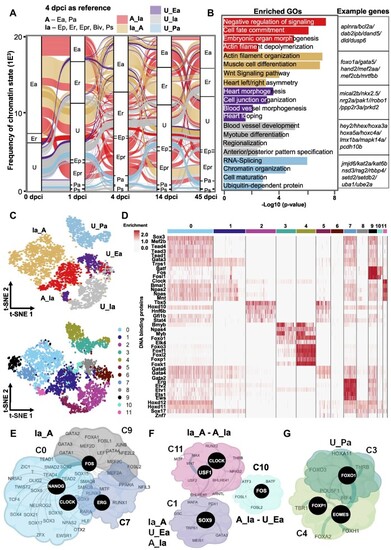
Switch between inactive to active chromatin states four days after injury. (A) Alluvial plot representing dynamic chromatin states with a reference point 4 dpci. (B) GO terms of the genes within the dynamic chromatin state groups presented in panel A. Example genes from each GO are presented to the right. The P-value was determined by ORA. (C) T-distributed stochastic neighbor embedding (t-SNE) visualization displaying the dynamic chromatin state transition groups (top) and the distribution of TF motifs (bottom). (D) Heatmap showing the enrichment of TF motifs in the clusters presented in (C, bottom panel). (E–G) Interaction network of TFs with enriched motifs in all clusters associated with Ia_A transition (E), the highly dynamic C1, C10 and C11 clusters (F) and C3 and C4 associated with U_Pa transition (G) at 4 dpci.

Expression Data

Expression Detail
Antibody Labeling
Phenotype Data

Phenotype Detail
Acknowledgments
This image is the copyrighted work of the attributed author or publisher, and ZFIN has permission only to display this image to its users. Additional permissions should be obtained from the applicable author or publisher of the image. Full text @ Nucleic Acids Res.