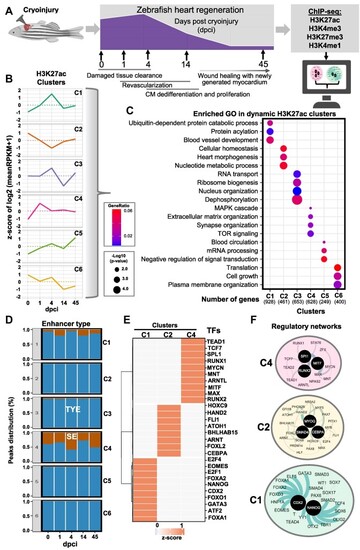
H3K27ac dynamics during zebrafish heart regeneration. (A) Schematic representation of the experimental setup of the study. (B) Unsupervised k-means clustering of normalized enrichment of H3K27ac at different time points after cryoinjury of zebrafish hearts. Clustering was performed using positively correlating H3K27ac peaks with the expression of associated genes. Values are the z-score from the log2 of the mean of RPKM + 1. (C) Dot plots displaying the representative gene ontology (GO) terms of genes associated to peaks in the different H3K27ac clusters. (D) Percentage of super enhancers (SE, brown) and typical enhancers (TYE, blue) in the different clusters during the course of regeneration. Rank Ordering of Super Enhancer (ROSE) for H3K27ac peaks was performed to identify SE. (E) Heatmap showing the TF motifs associated to the different clusters of H3K27ac. (F) Interaction network of TFs identified by motif analysis of genomic regions within clusters 4 (C4) (top panel), cluster 2 (C2, middle panel) and cluster 1 (C1, bottom panel). For this and the following figures, black circles represent TFs with the highest interaction score according to STRING database (default settings). The thickness of the line connecting the different proteins represents the strength of the protein-protein interaction.
|
