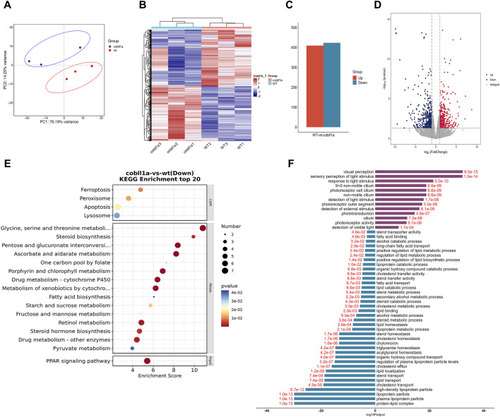
The DEGs analysis of WT and cobll1a−/− zebrafish embryo transcriptomes. (A) PCA cluster analysis of WT and cobll1a mutant zebrafish embryos demonstrated a significant correlation among three biological replicates in both the WT and cobll1a mutant groups. (B) Clustering heat maps of WT and cobll1a−/− were divided into two distinct groups. (C) The total number of differential genes in WT and cobll1a mutant zebrafish embryo samples was represented, with red denoting 409 up-regulated genes and blue indicating 423 down-regulated genes. (D) The volcano map displays DEGs between the two groups, with red representing up-regulated genes, blue signifying down-regulated genes, and gray denoting non-DEGs. Each dot represents a gene. (E) KEGG analysis of down-regulated DEGs revealed a significantly enriched pathway. (F) GO enrichment analysis of DEGs provides a description of their functions. Purple indicates up-regulated genes, blue represents down-regulated genes, and red fonts depict corrected p-values. Black font is used for the GO feature comment.
|
