
FIGURE 4
- ID
- ZDB-IMAGE-240503-29
- Publication
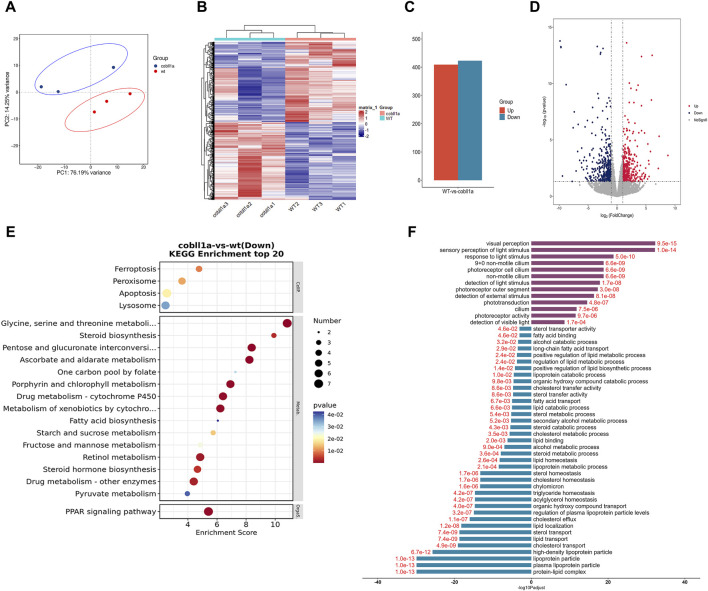
- Zeng et al., 2024 - Zebrafish cobll1a regulates lipid homeostasis via the RA signaling pathway
- All Figures
- Figures for Zeng et al., 2024
|
FIGURE 4
The DEGs analysis of WT and