
Fig. 1
- ID
- ZDB-FIG-240426-17
- Publication
- Tran et al., 2024 - Caffeine-induced protein kinase A activation restores cognitive deficits induced by sleep deprivation by regulating O-GlcNAc cycling in adult zebrafish
- Other Figures
- All Figure Page
- Back to All Figure Page
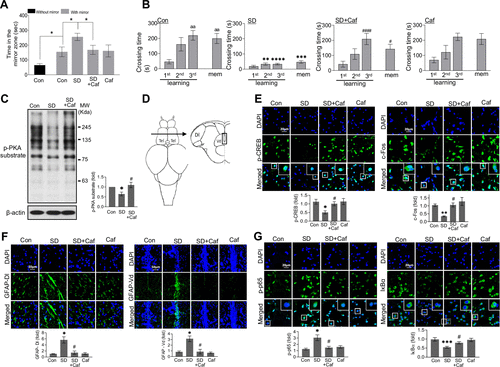
Effects of caffeine on sleep deprivation (SD)-induced behavioral deficits, PKA/CREB signaling, and neuroinflammation in zebrafish. Adult zebrafish were induced with sleep deprivation (SD) through extended light exposure for 3 days (72 h). Some groups received daily intraperitoneal (IP) injections of caffeine (10 μg/g) for three consecutive days. A: the mirror biting test compared stay time in the mirror zone among different groups of fish, analyzed using the Kruskal–Wallis test with false discovery rate (FDR) correction for statistical analysis (n = 7 or 8 fish/group, *P < 0.05). The experiments were independently replicated three times. B: graphs represent crossing time in the training session and memory task of the fear context memory test after 2 h (n = 8–10 fish/group). Statistical analysis involved the Kruskal–Wallis test with FDR (aaP < 0.01 vs. the 1st FC of Con) and two-way ANOVA followed by FDR test (**P < 0.01, ***P < 0.001, ****P < 0.0001 vs. Con; #P < 0.05, ####P < 0.0001 vs. SD). The experiments were independently replicated three times. C: representative Western blot images and quantification graphs of p-PKA substrate and β-actin of Con, SD, and SC (SD+Caf) from protein lysates extracted from zebrafish brains (n = 4 replicates/group, *P < 0.05 vs. Con; #P < 0.05 vs. SD). D: schematic drawings illustrate the telencephalon (Tel), the dorsal telencephalic region (Dl), and ventral telencephalic (Vd) of the zebrafish brain. E: representative confocal images (×40) obtained at the dorsal telencephalic region (Dl) of zebrafish brain 6 h after fear conditioning (FC) of DAPI (blue), pCREB (green), c-Fos (green), and merged staining images. Enlarged images are presented in the white box. Scale bar = 20 μm. Graphs show densitometric quantification of p-CREB and c-Fos (n = 3 fish/group, *P < 0.05, **P < 0.01 vs. Con; #P < 0.05 vs. SD). F: representative immunofluorescence images (×40) of DAPI (blue), GFAP (green), and merged staining of the Dl (scale bar = 20 μm) and Vd (scale bar = 50 μm) regions of zebrafish brains. Enlarged images are presented in the white box. Graphs show densitometric quantification (n = 3 fish/group, *P < 0.05 vs. Con; #P < 0.05 vs. SD). G: representative confocal images (×40) obtained at the Dl region of the telencephalon of zebrafish brain showing p65, IkBα (green), DAPI (blue), and merged images with densitometric quantification graphs (n = 3–5 fish/group, ***P < 0.001 vs. Con; #P < 0.05 vs. SD). Enlarged images are presented in the white box. Scale bar = 20 μm. The Kruskal–Wallis test with FDR was used for all immunofluorescence staining quantifications. Caf, caffeine; Con, control; CREB, cAMP response element-binding protein; FC, fear conditioning; FDR, false discovery rate; GFAP, glial fibrillary acidic protein; p-CREB, phosphorylated-cAMP response element-binding protein; PKA, protein kinase A. |