
Fig. 3
- ID
- ZDB-FIG-240426-10
- Publication
- Zhang et al., 2024 - Inducing aortic aneurysm/dissection in zebrafish: evaluating the efficacy of β-Aminopropionic Nitrile as a model
- Other Figures
- All Figure Page
- Back to All Figure Page
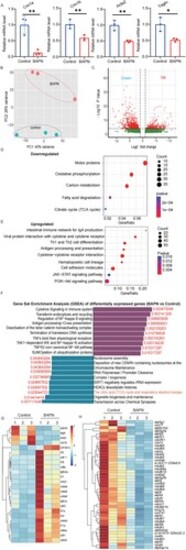
Verification of molecular mechanisms after immersion in BAPN induction in adult zebrafish. A, exhibits a histogram illustrating the relative expression levels of CNN1a, CNN1b, ACTA2, and TAGLN in control and BAPN-treated zebrafish, as determined by qPCR. Statistical significance was assessed using an unpaired t-test, with a sample size of 3 zebrafish per group and a total of three groups (*P < 0.05; **P < 0.01). B, Principal component (PC) analysis. C, presents a volcano plot illustrating all the differentially expressed genes (DEGs). D and E, KEGG pathway enrichment analyses for up- and downregulated differentially expressed genes (DEGs). F, encompassed Reactome Gene Set Enrichment Analysis (GSEA), with a cut-off p-value set at 0.05. Heatmap for DEGs annotated as (G) ‘smooth muscle phenotypic transformation’ and (H) ‘oxidative phosphorylation’ in the KEGG database. |