
- Title
-
Inducing aortic aneurysm/dissection in zebrafish: evaluating the efficacy of β-Aminopropionic Nitrile as a model
- Authors
- Zhang, J., Liang, Y., Zeng, W., Gao, X., Wang, D., Mai, C., Lin, Z., Zhao, H., Li, X.
- Source
- Full text @ Animal Cells Syst (Seoul)

BAPN induced dorsal aortic widening and aortic arch deformity in larval zebrafish. A, statistical analysis of the diameter of the dorsal aorta of Tg[flk:eGFP] zebrafish with a sample size of n = 10 and a significant difference of *** < 0.001. B and C, statistical analysis of the dorsal aortic diameter in response to four different concentrations of BAPN, and the control groups on the 3rd, 5th, and 7th days post-treatment. The scale bars indicate a magnification of 60 μm (10x), with a sample size of n = 10. Statistical significance is denoted as * < 0.05, ** < 0.001, and *** < 0.0001. D, Blood vessel abnormalities following BAPN administration, revealing the presence of fibrous tissue-like mass in the zebrafish body. In the present study, figure E shows the zebrafish control group and the group treated with BAPN under a confocal focus of 50 μM. These results indicated that the administration of BAPN led to the deformation of the aortic arch. Furthermore, the statistical graph F displays the observed malformation of the aortic arch in diagram E, with a sample size of n = 8. |
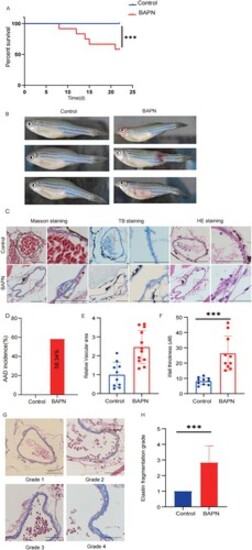
BAPN induced AAD-related pathological changes in adult zebrafish. A, the survival rate of the zebrafish during the 22-day administration period is presented through statistical analysis and a significant difference of ***<0.001. B, a notable distinction can be observed between the zebrafish group administered with BAPN and the control group on the 22nd day after three months of treatment. It is evident that the treatment of BAPN leads to the occurrence of multiple blood vessel bleedings in the body and abnormal changes in the development of the notochord. C, the differences observed after the administration of BAPN are depicted in the masson, TB, and HE stained sections. The scale bars in the images represent a measurement of 100 μm (100 x). D, based on the pathological changes of zebrafish dorsal aorta, the incidence of AAD after treatment of zebrafish BAPN was statistically analyzed, n = 12; E and F, statistics of relative area and wall thickness of blood vessels in pathological sections; G and H, elastin staining showed fragmentation grades. Grading keys are shown on the left (p < 0.05), Scale bars: 100 μm (100 x). Data are presented as mean ± SEM. *p < 0.05. |
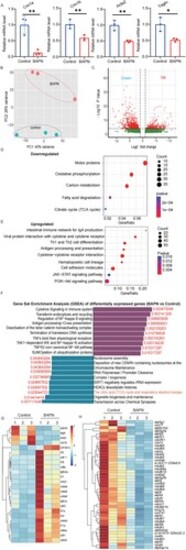
Verification of molecular mechanisms after immersion in BAPN induction in adult zebrafish. A, exhibits a histogram illustrating the relative expression levels of CNN1a, CNN1b, ACTA2, and TAGLN in control and BAPN-treated zebrafish, as determined by qPCR. Statistical significance was assessed using an unpaired t-test, with a sample size of 3 zebrafish per group and a total of three groups (*P < 0.05; **P < 0.01). B, Principal component (PC) analysis. C, presents a volcano plot illustrating all the differentially expressed genes (DEGs). D and E, KEGG pathway enrichment analyses for up- and downregulated differentially expressed genes (DEGs). F, encompassed Reactome Gene Set Enrichment Analysis (GSEA), with a cut-off p-value set at 0.05. Heatmap for DEGs annotated as (G) ‘smooth muscle phenotypic transformation’ and (H) ‘oxidative phosphorylation’ in the KEGG database. |