|
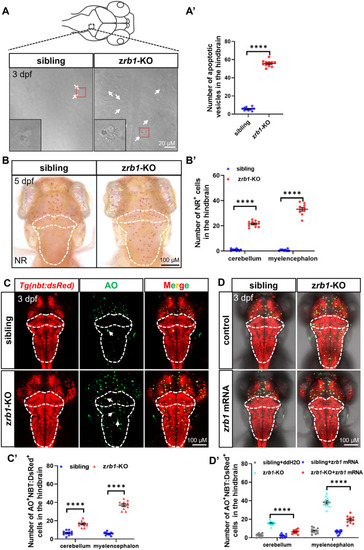
Rb1 deficiency induced increased neuronal apoptosis of the hindbrain. A Apoptotic vesicles in the hindbrain in siblings and zrb1-KO mutants at 3 dpf. The white arrows indicate the location of apoptotic vesicles. The image at the bottom left is a magnification of 400 for the red broken line area. A′ The statistical plot of apoptotic vesicles in the hindbrain of siblings and zrb1-KO mutants (t-test; mean ± SEM; ****P < 0.0001; n = 8). B Stained by NR to visualize microglia in the cerebellum and myelencephalon of siblings and zrb1-KO mutants at 5 dpf. The white dotted line outlines the cerebellum and myelencephalon. B′ The statistical plot of NR+ cells in the cerebellum and myelencephalon in siblings and zrb1-KO mutants (t-test; mean ± SEM; ****P < 0.0001; n = 10). C Co-staining of AO signals (green) and Tg(nbt:dsRed) of siblings and zrb1-KO mutants at 3 dpf. The white dotted line outlines the cerebellum and myelencephalon. The white arrows indicate the apoptotic cells. C′ The statistical plot of the number of AO+/NBT-dsRed+ cells in the cerebellum and myelencephalon of siblings and zrb1-KO mutants (t-test; mean ± SEM; ****P < 0.0001; n = 10). D Co-staining with AO (green) and Tg(nbt:dsRed) in 3 dpf sibling embryos and zrb1-KO mutants after injecting with control and zrb1 mRNA. D′ Quantification of AO+/NBT-dsRed+ cells of the cerebellum and myelencephalon in all groups of (D) (one-way ANOVA; mean ± SEM; **P < 0.01; ****P < 0.0001; n = 10).
|