IMAGE

Fig. 3

ID
ZDB-IMAGE-240422-31
Source
Figures for Zhao et al., 2024
Image
Figure Caption

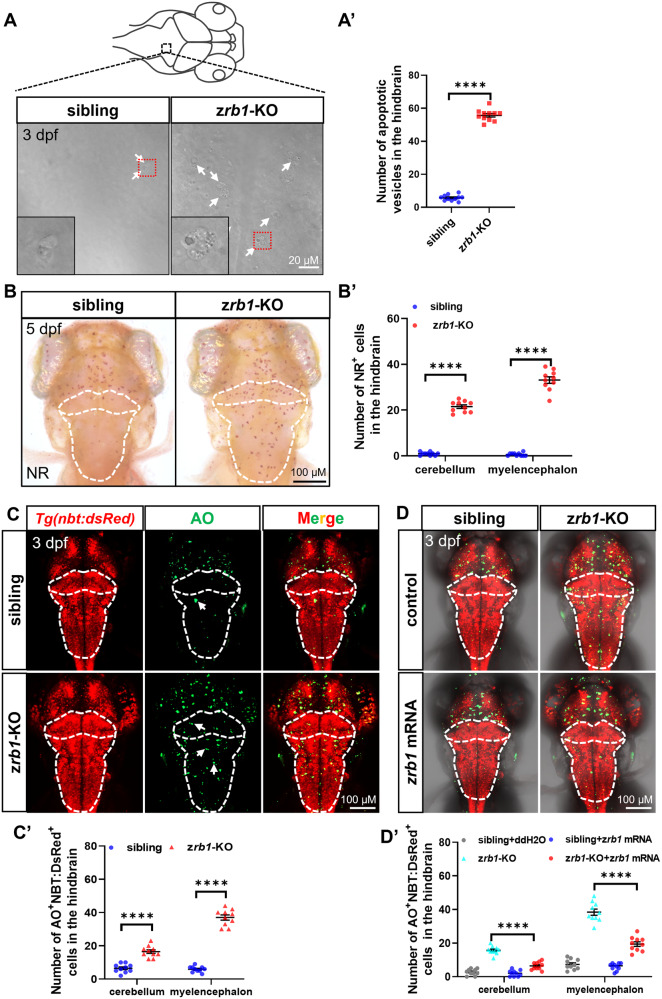
Fig. 3 Rb1 deficiency induced increased neuronal apoptosis of the hindbrain.

A Apoptotic vesicles in the hindbrain in siblings and zrb1-KO mutants at 3 dpf. The white arrows indicate the location of apoptotic vesicles. The image at the bottom left is a magnification of 400 for the red broken line area. A′ The statistical plot of apoptotic vesicles in the hindbrain of siblings and zrb1-KO mutants (t-test; mean ± SEM; ****P < 0.0001; n = 8). B Stained by NR to visualize microglia in the cerebellum and myelencephalon of siblings and zrb1-KO mutants at 5 dpf. The white dotted line outlines the cerebellum and myelencephalon. B′ The statistical plot of NR+ cells in the cerebellum and myelencephalon in siblings and zrb1-KO mutants (t-test; mean ± SEM; ****P < 0.0001; n = 10). C Co-staining of AO signals (green) and Tg(nbt:dsRed) of siblings and zrb1-KO mutants at 3 dpf. The white dotted line outlines the cerebellum and myelencephalon. The white arrows indicate the apoptotic cells. C′ The statistical plot of the number of AO+/NBT-dsRed+ cells in the cerebellum and myelencephalon of siblings and zrb1-KO mutants (t-test; mean ± SEM; ****P < 0.0001; n = 10). D Co-staining with AO (green) and Tg(nbt:dsRed) in 3 dpf sibling embryos and zrb1-KO mutants after injecting with control and zrb1 mRNA. D′ Quantification of AO+/NBT-dsRed+ cells of the cerebellum and myelencephalon in all groups of (D) (one-way ANOVA; mean ± SEM; **P < 0.01; ****P < 0.0001; n = 10).

Acknowledgments
This image is the copyrighted work of the attributed author or publisher, and ZFIN has permission only to display this image to its users. Additional permissions should be obtained from the applicable author or publisher of the image. Full text @ Cell Death Discov