
Fig. 5
- ID
- ZDB-FIG-240419-75
- Publication
- Yao et al., 2024 - Rab11 promotes single Mauthner cell axon regeneration in vivo through axon guidance molecule Ntng2b
- Other Figures
- All Figure Page
- Back to All Figure Page
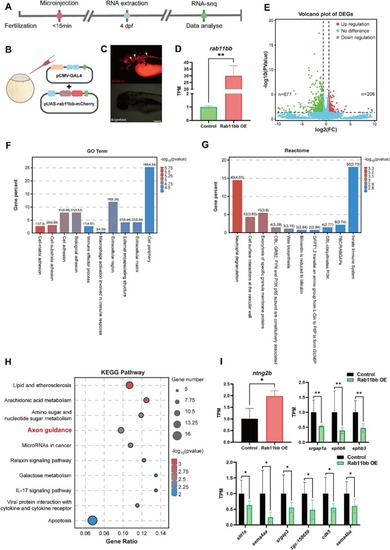
RNA-seq revealed that the regenerative promoting mechanism of Rab11bb was related to the axon guidance pathway. (A) Timeline of time points of microinjection, RNA extraction and RNA-seq. (B, C) Schematic diagram of microinjection to overexpress Rab11bb and the positive expression of overexpressed plasmid at 4 dpf. Scale bar, 0.2 mm. (D) RNA-seq analysis of rab11bb overexpression efficiency. The total RNA of each group (n = 30) was obtained from three independent experiments. Assessed by unpaired, two-tailed Student's t-test. ** p < 0.01. (E) The volcano plot shows the expression profiling between the two groups. The vertical dotted lines refer to a 2.0-fold (log2 scaled) up-regulation and down-regulation, respectively. The horizontal dotted line corresponds to a p-value of 0.05 (−log10 scaled). The red and green points in the plot represent DEGs with statistical significance. * p < 0.05. (F) The GO enrichment analysis (biological process terms) of DEGs. The figure shows top 10 terms on the x-axis that are significantly enriched by a p-value of 0.05 (−log10 scaled). The y-axis displays the gene percent to all GO biological process terms. (G) The Reactome pathway enrichment analysis of DEGs. The figure shows top 10 pathways on the x-axis that are significantly enriched by a p-value of 0.05 (−log10 scaled). The y-axis displays the gene percent to all Reactome pathways. (H) Enrichment for KEGG pathway analysis of DEGs. The x-axis displays the gene ratio in each pathway. The y-axis shows the top 10 pathways that are significantly enriched. The bubble size indicates the number of genes. The color bar indicates the corrected p-value, the red represents higher value, the blue represents lower value. p-value of 0.05 (−log10 scaled). (I) Quantitative histogram of expression analysis of the DEGs in the axon guidance pathway by RNA-seq between experiment and control group. * p < 0.05, ** p < 0.01. |