
Fig. 1
- ID
- ZDB-FIG-240419-71
- Publication
- Yao et al., 2024 - Rab11 promotes single Mauthner cell axon regeneration in vivo through axon guidance molecule Ntng2b
- Other Figures
- All Figure Page
- Back to All Figure Page
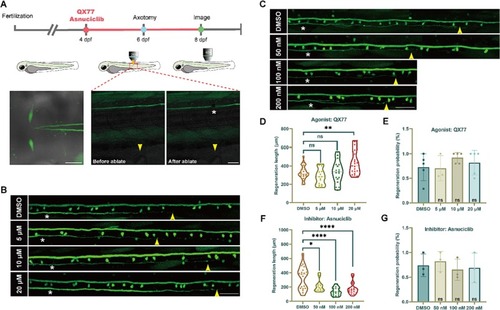
Systemic intervention with Rab11 promoted M-cells axon regeneration. (A) Above is timeline of time points of pharmacological treatment, axotomy and imaging. Below are diagram of M-cells soma and crossed axon initial segment. Representative images of the M-cell axon before and after ablation by two-photon laser. Asterisk, ablation site; Arrowhead, cloacal pore; Scale bar, 50 μm. (B, C) Representative diagram of confocal imaging of M-cells axon regeneration between DMSO and agonist/inhibitor (concentration gradient, QX77: 5 μΜ, 10 μM, 20 μM; Asnuciclib: 50 nM, 100 nM, 200 nM). Asterisk, ablation site; Arrowhead, axon regeneration terminal; Scale bar, 50 μm. (D, F) Violin plot shows that statistical quantification of axon regeneration. (QX77: DMSO, 326.9 ± 14.89 μm, n = 24; 5 μΜ, 279.4 ± 22.19 μm, n = 15; 10 μM, 333.8 ± 28.12 μm, n = 18; 20 μM, 433.0 ± 26.67 μm, n = 21. Asnuciclib: DMSO, 328.7 ± 37.14 μm, n = 19; 50 nM, 211.8 ± 23.07 μm, n = 13; 100 nM, 136.6 ± 12.79 μm, n = 18; 200 nM, 179.3 ± 20.09 μm, n = 18.) Assessed by one-way ANOVA. * p < 0.05, ** p < 0.01, **** p < 0.0001, ns, no significance. (E, G) Statistical diagram of successful probability of M-cells axon regeneration after drugs treatment with different concentrations (probability range: 70% - 92%. QX77: DMSO, 72.6 ± 12.2%; 5 μΜ, 70.5 ± 14.8%; 10 μM, 92 ± 4.9%; 20 μΜ, 82 ± 11.4%; Asnuciclib: DMSO, 74.1 ± 13.3%; 50 nM, 81.39 ± 11.7%; 100 nM, 65.2 ± 12.5%; 200 nM, 68.9 ± 17.36%). The results were obtained from 3 to 5 independent experiments. Assessed by unpaired, two-tailed Student's t-test. ns, no significance. |