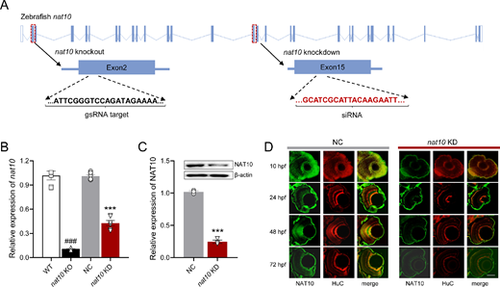
Disruption of nat10 in zebrafish via CRISPR/Cas9 and siRNA. (A) Illustrates the genomic structure of the zebrafish nat10 gene, highlighting the CRISPR/Cas9 target site in exon 2 (orange underline) and the siRNA target site in exon 15 (red underline) for knockout and knockdown, respectively. (B) Quantitative analysis of nat10 mRNA expression levels in wild-type (WT), nat10 knockout (KO), negative control (NC), and nat10 knockdown (KD) zebrafish using real-time PCR. Results are presented as mean ± SEM from six independent experiments. Statistical analysis was performed using 1-way ANOVA with the Tukey post hoc test; ###P < 0.001 vs. WT, ***P < 0.001 vs. NC. (C) Western blot analysis of NAT10 protein expression in NC and nat10 KD zebrafish. Data are expressed as mean ± SEM from 3 independent experiments, analyzed with an unpaired two-tailed Student’s t-test; **P < 0.01 vs. NC. (D) Histological sections stained with NAT10 (green) and HuC (red) from NC and nat10 KD zebrafish retinas at 10 hpf, 24 hpf, 48 hpf, and 72 hpf. Scale bar = 50 µm.
|
