
Fig. 2
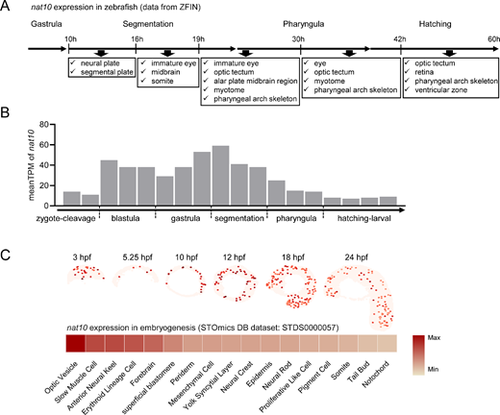
Spatiotemporal expression patterns of nat10 in zebrafish. (A) A schematic representation delineating the spatial and temporal expression of nat10 during zebrafish embryogenesis, as sourced from the Zebrafish Information Network (ZFIN, https://zfin.org/ZDB-GENE-040426-1543/expression). (B) A temporal expression profile of nat10 mRNA throughout zebrafish embryonic development, derived from the Expression Atlas dataset (http://www.ebi.ac.uk/gxa/experiments/E-ERAD-475). (C) A comprehensive mapping of the spatiotemporal distribution of nat10 expression in zebrafish embryogenesis using a dataset from the STOmics DB (https://db.cngb.org/stomics/datasets/STDS0000057). Upper panel: A detailed depiction of the spatial distribution of nat10 expression across progressive developmental stages. Lower panel: A heatmap illustrating the mean expression levels of nat10 in various spatial regions. |