
Fig. 9
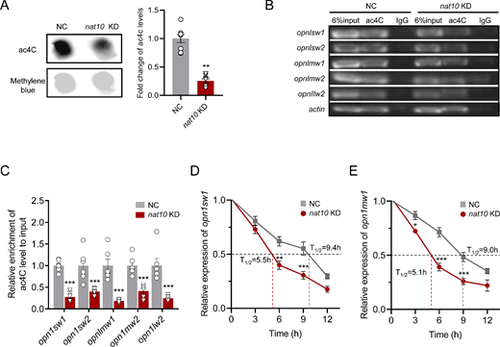
Impact of nat10 KD on ac4C levels and mRNA stability in opsins. (A) Right panel: A representative dot blot displaying ac4C levels in total RNA from the NC and nat10 KD zebrafish larvae. Left panel: Quantitative analysis of ac4C content in total RNA from both the NC and the nat10 KD groups, with results shown as mean ± SEM from eight independent experiments. Statistical analysis was performed using an unpaired two-tailed Student's t-test; ***P < 0.001 vs. NC. (B, C) RNA immunoprecipitation-PCR (RIP-PCR) analysis illustrating ac4C modifications in specific opsin mRNAs (opn1sw1, opn1sw2, opn1mw1, opn1mw2, opn1lw2, prph2b, and rom1a) in the NC and nat10 KD larvae, presented as mean ± SEM from six independent experiments. Statistical analysis was performed using 2-way ANOVA with the Tukey post hoc test; ***P < 0.001 vs. NC. (D, E) The stability of opn1sw1 (D) and opn1mw1 (E) mRNAs at five time points (0-12 hours) after actinomycin-D treatment, was quantified via RT-PCR. Results are presented as mean ± SEM from six independent experiments, with mean terminal half-lives (t1/2) indicated. Statistical analysis was performed using 2-way ANOVA with the Tukey post hoc test; *P < 0.001, ***P < 0.001 vs. NC. |