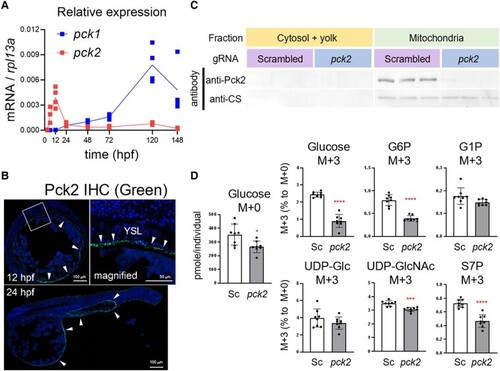
Pck2 takes a role in gluconeogenesis in YSL from glutamate. A) Relative expression levels of pck1 and pck2 in the developing zebrafish from 3 to 148 h postfertilization (hpf). B) Fluorescent immunohistochemistry (IHC) of the embryo sections by Pck2 antibody. Arrowheads indicate Pck2 immunosignals, and DAPI nuclei staining shows the general structure of the embryos. The squared region in the 12 hpf panel is magnified and shown on right side. Arrowheads indicate signals in YSL. (C) western blot analysis for Pck2 and citrate synthase (CS) in the 12-hpf zebrafish embryos after generation 0 (G0) knockout experiment. The fertilized eggs were injected with scrambled or pck2-targeting gRNA/Cas9 complex (N = 3). D) Levels of glucose M + 0 and relative M + 3 levels of glucose, glucose-6-phosphate (G6P), glucose-1-phosphate (G1P), UDP-glucose (UDP-Glc), UDP-N-acetylglucosamine (UDP-GlcNAc), and sedoheptulose-7-phosphate (S7P) in embryos subjected to G0 knockout with scrambled (Sc) or pck2-targeting (pck2) gRNA/Cas9 complex. Dots and bars denote individual and mean (±SD) values, and asterisks indicate significant difference between groups (Welch's t test, *P < 0.05; ***P < 0.001; ****P < 0.0001; N = 8).
|
