
Fig. 1.
- ID
- ZDB-FIG-240408-31
- Publication
- Furukawa et al., 2024 - Gluconeogenesis in the extraembryonic yolk syncytial layer of the zebrafish embryo
- Other Figures
- All Figure Page
- Back to All Figure Page
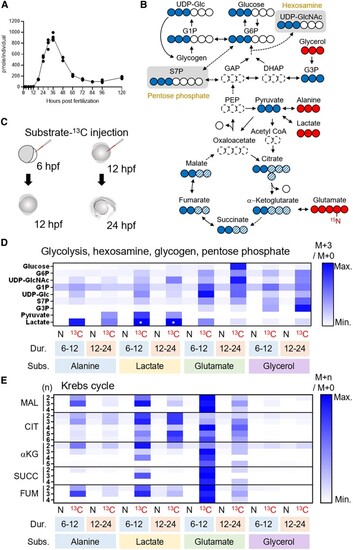
LC-MS-based isotope tracking demonstrates gluconeogenesis in zebrafish embryo. A) Glucose level increases from 12 to 36 hpf in the zebrafish. B) 13C-labeled isotopologues (filled circle, 13C; open circle, 12C) resulted from the substrates-13C (glycerol, alanine, lactate, and glutamate). For most metabolites in upper glycolysis, enrichment of mass + 3 (M + 3) isotopologues, which scarcely exist in nature, best represents the 13C inherited from the substrates-13C. Entry of substrate-13C into Krebs cycle gives rise to M + 2 to M + 6 isotopologues of the intermediates (filled and filled hatched circles). C) 6- or 12-hpf embryos took the injections of substrates-13C and given 6 or 12 h of incubation, followed by metabolite extraction. D) A rescaled heatmap showing relative M + 3 isotopologue enrichment (M + 3/M + 0) of the metabolites in upper glycolysis, hexosamine synthesis, glycogen synthesis, and pentose phosphate pathways in natural (N) or 13C-labeled (13C) substrate-injected embryos. The duration (Dur.) and substrates (Subs.) of the experiments are shown below the heatmap. Glucose M + 3 was most highly enriched in glutamate-13C5-injected 24-hpf embryos. Because M + 3 level of lactate was incomparably high in lactate-13C3-injected embryos (asterisks), these were given the same value of third-highest ones (alanine-13C3-injected samples) to show relative levels of other samples. E) A rescaled heatmap for relative enrichment of M + 2 to M + 5 isotopologues (M + |