
- Title
-
Gluconeogenesis in the extraembryonic yolk syncytial layer of the zebrafish embryo
- Authors
- Furukawa, F., Aoyagi, A., Sano, K., Sameshima, K., Goto, M., Tseng, Y.C., Ikeda, D., Lin, C.C., Uchida, K., Okumura, S.I., Yasumoto, K., Jimbo, M., Hwang, P.P.
- Source
- Full text @ PNAS Nexus
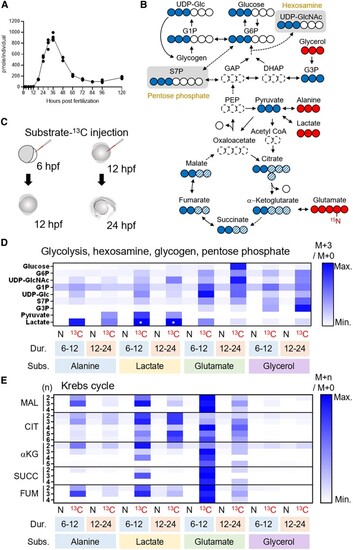
LC-MS-based isotope tracking demonstrates gluconeogenesis in zebrafish embryo. A) Glucose level increases from 12 to 36 hpf in the zebrafish. B) 13C-labeled isotopologues (filled circle, 13C; open circle, 12C) resulted from the substrates-13C (glycerol, alanine, lactate, and glutamate). For most metabolites in upper glycolysis, enrichment of mass + 3 (M + 3) isotopologues, which scarcely exist in nature, best represents the 13C inherited from the substrates-13C. Entry of substrate-13C into Krebs cycle gives rise to M + 2 to M + 6 isotopologues of the intermediates (filled and filled hatched circles). C) 6- or 12-hpf embryos took the injections of substrates-13C and given 6 or 12 h of incubation, followed by metabolite extraction. D) A rescaled heatmap showing relative M + 3 isotopologue enrichment (M + 3/M + 0) of the metabolites in upper glycolysis, hexosamine synthesis, glycogen synthesis, and pentose phosphate pathways in natural (N) or 13C-labeled (13C) substrate-injected embryos. The duration (Dur.) and substrates (Subs.) of the experiments are shown below the heatmap. Glucose M + 3 was most highly enriched in glutamate-13C5-injected 24-hpf embryos. Because M + 3 level of lactate was incomparably high in lactate-13C3-injected embryos (asterisks), these were given the same value of third-highest ones (alanine-13C3-injected samples) to show relative levels of other samples. E) A rescaled heatmap for relative enrichment of M + 2 to M + 5 isotopologues (M + |

Zebrafish yolk syncytial layer (YSL) expresses genes responsible for gluconeogenesis. A) In situ hybridization signals of gluconeogenic genes expressed in YSL of zebrafish embryos at 12- and 24-h postfertilization (hpf). The gene names are shown on the left side of the panels. For sense-probe controls and genes not expressed in YSL, please see Fig. |
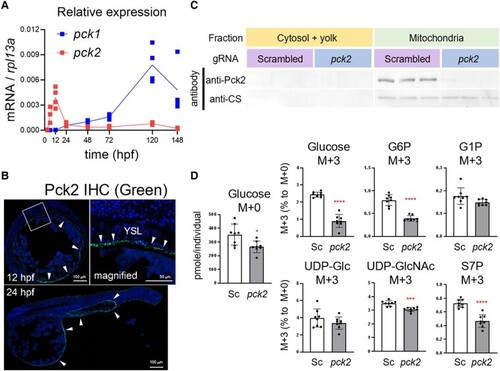
Pck2 takes a role in gluconeogenesis in YSL from glutamate. A) Relative expression levels of |
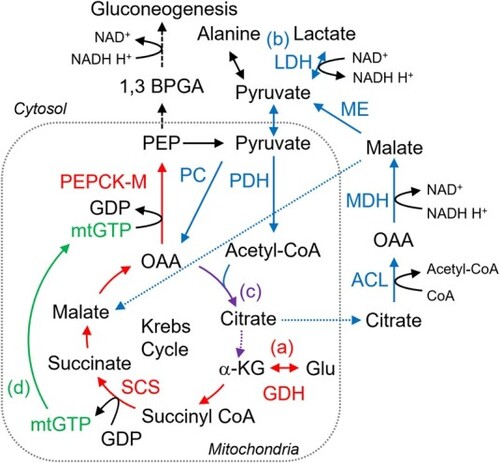
Possible metabolic pathways in YSL found in this study. The pathways originating glutamate (Glu), lactate, and both are labeled with (a), (b), and (c), respectively. Glu is converted to α-ketoglutarate (αKG) by glutamate dehydrogenase (GDH), metabolized through Krebs cycle to oxaloacetate (OAA), and used to produce phosphoenolpyruvate (PEP) via PEPCK-M reaction, while this enzyme hydrolyzes mtGTP. Here, succinyl-CoA synthetase (SCS) in Krebs cycle provides mtGTP, labeled with (d). Lactate, following conversion to pyruvate, enters Krebs cycle by two separated pathways: to OAA via pyruvate carboxylase (PC) or to acetyl-CoA via pyruvate dehydrogenase (PDH). The former provides new Krebs cycle intermediate, while the latter only helps revolution of this cycle. Considerable amount of citrate is likely transported out of mitochondria and metabolized back to pyruvate via ATP-citrate lyase (ACL), malate dehydrogenase (MDH), and malic enzyme (ME). |