|
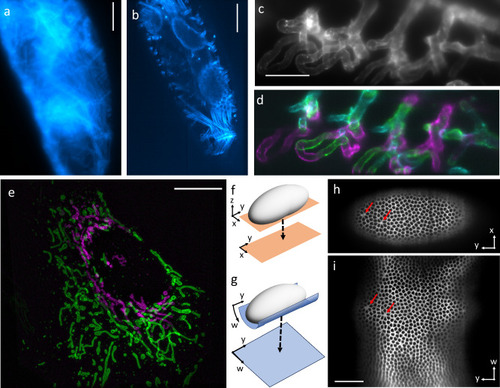
Variation of projection parameters on different biological samples. a Projection of a Drosophila embryo labeled with UAS-actin5C-RFP using OPMpro. b OPMprops projection of the same embryo. c Projection of the gill vasculature labeled with the vascular marker Tg(kdrl:Hsa.HRAS-mCherry) in a zebrafish larva using OPMpro. d Three sequentially acquired projections using OPMprops. The projections divide the volume in c into sub-compartments, which are color-coded in magenta, green, and cyan, respectively. Both the Drosophila and zebrafish imaging were repeated independently 5 times with similar results. e A single osteosarcoma (U-2 OS) cell, as imaged with oblique plane structured illumination microscopy (OPSIM) using props. Green are mitochondria in a projection layer adjacent to the coverslip, magenta are mitochondria in a projection layer 4 microns above the coverslip. The two projections were acquired sequentially. The imaging experiment was repeated independently 3 times with similar results. f Schematic representation of imaging an x–y layer (orange) near the bottom of a Drosophila embryo (gray) that is mapped in a top-down view (dotted arrow). g Schematic representation of a curved surface (blue) that is mapped into a planar projection (dotted arrow). h XY projection of a Drosophila embryo labeled with myosin-FRB-GFP. i Curved projection of the same embryo. Red arrows point to selected features visible in both (h) and (i). The imaging experiment was repeated independently 4 times with similar results. Scale Bars: a–c: 50 microns, e: 10 microns, i: 50 microns.
|