FIGURE SUMMARY
Title

Projective light-sheet microscopy with flexible parameter selection

Authors
Chen, B., Chang, B.J., Daetwyler, S., Zhou, F., Sharma, S., Lee, D.M., Nayak, A., Noh, J., Dubrovinski, K., Chen, E.H., Glotzer, M., Fiolka, R.
Source
Full text @ Nat. Commun.

Concept of projections with parameter selection (props).

a Schematic overview of the imaging geometry in oblique plane microscopy (OPM) and lattice light-sheet microscopy (LLSM). The sample is rapidly scanned with a light sheet (blue) and corresponding focal plane, which is termed a “focal sweep”. If the focal sweep is completed during one camera exposure, an optical projection is formed. b Translating the image on the camera (red arrow labeled “shear”) during a focal sweep results in projections under different viewing angles. On the right, a top-down projection along the z-axis is shown. c When a rolling shutter (red boxes) is synchronized to the shear translation along the camera, a projection of a sub-volume (red shaded area in a) is formed. d, e Schematic illustration of varying the projection depth with the rolling shutter width. The red-shaded volumes illustrate the regions of the sample that are projected below, illustrated as a top-down view. f Illustration of shifting the projection volume axially by introducing a time delay between the rolling shutter and the focal sweep and shearing. g A nonlinear scanning waveform results in an axial change within the projection volume. h LLSMprops imaging of A375 cells labeled with F-tractin-EGFP with varying projection depth, top row: top-down view, bottom row: corresponding 45° viewing angle. The imaging experiment was repeated independently 3 times with similar results. i, j Mesoscopic OPMprops imaging of zebrafish vasculature, labeled with Tg(kdrl:EGFP), over a projection depth of 4 and 362 microns, respectively. The imaging experiment was repeated independently 4 times with similar results. Scale Bar: h: 10 microns, j: 500 microns.

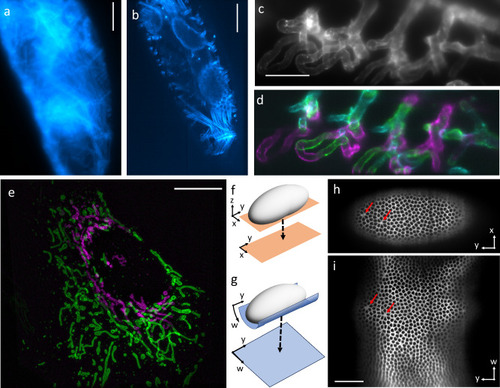
Variation of projection parameters on different biological samples.

a Projection of a Drosophila embryo labeled with UAS-actin5C-RFP using OPMpro. b OPMprops projection of the same embryo. c Projection of the gill vasculature labeled with the vascular marker Tg(kdrl:Hsa.HRAS-mCherry) in a zebrafish larva using OPMpro. d Three sequentially acquired projections using OPMprops. The projections divide the volume in c into sub-compartments, which are color-coded in magenta, green, and cyan, respectively. Both the Drosophila and zebrafish imaging were repeated independently 5 times with similar results. e A single osteosarcoma (U-2 OS) cell, as imaged with oblique plane structured illumination microscopy (OPSIM) using props. Green are mitochondria in a projection layer adjacent to the coverslip, magenta are mitochondria in a projection layer 4 microns above the coverslip. The two projections were acquired sequentially. The imaging experiment was repeated independently 3 times with similar results. f Schematic representation of imaging an xy layer (orange) near the bottom of a Drosophila embryo (gray) that is mapped in a top-down view (dotted arrow). g Schematic representation of a curved surface (blue) that is mapped into a planar projection (dotted arrow). h XY projection of a Drosophila embryo labeled with myosin-FRB-GFP. i Curved projection of the same embryo. Red arrows point to selected features visible in both (h) and (i). The imaging experiment was repeated independently 4 times with similar results. Scale Bars: ac: 50 microns, e: 10 microns, i: 50 microns.

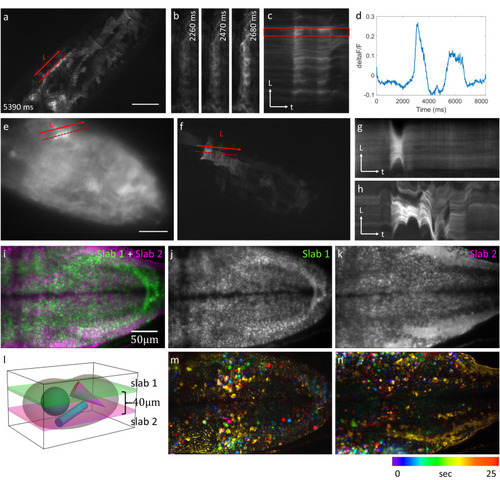
Selective projection imaging of calcium dynamics.

ad Calcium dynamics in a Drosophila embryo labeled with jGCaMP7s-CAAX imaged at a rate of 50 Hz using OPMprops. b Zoomed-in views of the area surrounding the dashed line in (a). c Kymograph along the dotted line in (a). d Calcium signal analysis (dF/F) from the box in (c). e Projection image of another jGCaMP7s-CAAX labeled embryo using OPMpro. f Same embryo as in (e), but imaged with OPMprops at 20 Hz framerate. g Kymograph along the dotted line in (e). h Kymograph along the dotted line in (f). in OPMprops imaging at two depths within a zebrafish larva labeled with Tg(elavl3:soma-GCaMP7f). i Overlay of the two projections. j, k Individual projections. l Schematic representation of the projection imaging. The two sub-volumes (“slabs”) are separated by 40 microns. mn Color-coded timeseries corresponding to j, k where the static background was subtracted. Both the Drosophila embryo and zebrafish larva imaging were repeated independently 3 times with similar results. Source data are provided as a Source Data file.

Acknowledgments
This image is the copyrighted work of the attributed author or publisher, and ZFIN has permission only to display this image to its users. Additional permissions should be obtained from the applicable author or publisher of the image. Full text @ Nat. Commun.