FIGURE

FIGURE 2

ID
ZDB-FIG-240327-2
Publication
Angom et al., 2024 - Forward genetic screen using a gene-breaking trap approach identifies a novel role of grin2bb-associated RNA transcript (grin2bbART) in zebrafish heart function
Other Figures
All Figure Page
Back to All Figure Page
FIGURE 2

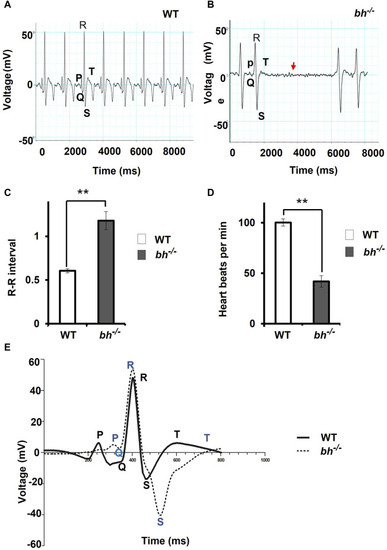
The electrocardiogram profile of bigheart fish indicates signs of arrhythmia. (A) Electrocardiogram recordings of wild-type (bh+/+) zebrafish. X-axis represents time in milliseconds (ms), and Y-axis represents voltage in millivolts (mV). (B) Electrocardiogram recording of bh−/− fish, red arrowhead represents the absence of beats. (C) Graph representing the R-R interval in wild type and bh−/− fish. (D) Graph representing heart beat rate in adult wild type (bh+/+) zebrafish and bh−/− fish. (E) Graph showing an overlay of wild type and bh−/− mutant ECG recordings (Regular line and dashed line represents the ECG profiles of wild type and bh−/− fish, respectively). P, Q, R, S and T represent regular ECG waves. (**, p < 0.01). The bars indicate the average values ± SD.

Expression Data

Expression Detail
Antibody Labeling
Phenotype Data

Phenotype Detail
Acknowledgments
This image is the copyrighted work of the attributed author or publisher, and ZFIN has permission only to display this image to its users. Additional permissions should be obtained from the applicable author or publisher of the image. Full text @ Front Cell Dev Biol