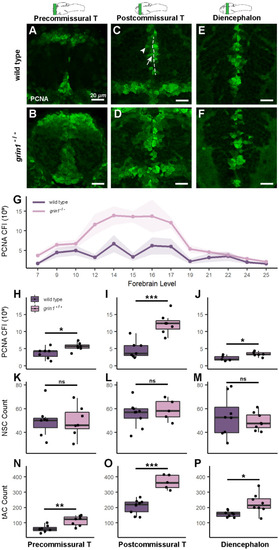
NMDA receptors suppress proliferation in neuroblasts (transit amplifying cells). (A–F) PCNA expression in wild-type (A, C, & E) and grin1−/− (B, D, & F) fish at 3 dpf in the precommissural telencephalon (A & B), postcommissural telencephalon (C & D) and diencephalon (E & F). PCNA is enriched in abventicular and cell rich regions of the parenchyma in the mutant fish. In (C), sample of PVZ (dotted line), example RGC at PVZ (arrow), example abventricular tAC (arrowhead). Brain schematics above images indicate the gross anatomical regions sampled. Brain schematics after Mueller & Wullimann (2016). (G) Line graph with points showing the mean corrected fluorescence intensity (CFI) for each genotype, at each anatomical level assayed from anterior to posterior (left to right). Ribbon surrounding line graph indicates standard error of the mean. Anatomical levels are numbered according to Mueller & Wullimann (2016) (see "Materials and methods"). Wild type n = 7; grin1−/− n = 7. t-test, p = 0.0009. (H–P) Box and whisker plots of different analysis of three anatomical levels: precommissural telencephalon, postcommissural telencephalon, and diencephalon. Wild type and grin1−/− sample sizes and p value (t-test): (H–J) PCNA CFI values: precommissural telencephalon (H) 7, 7, p = 0.03; postcommissural telencephalon (I) 7, 7, p = 0.0003; diencephalon (J) 5, 7, p = 0.01. (K–M) PCNA+ NSC counts: precommissural telencephalon (K) 7, 7, p = 0.95; postcommissural telencephalon (L) 9, 5, p = 0.54; diencephalon (M) 8, 8, p = 0.54. (N–P) PCNA+ tACs cell counts: precommissural telencephalon (N) 7, 7, p = 0.005; postcommissural telencephalon (O) 9, 5, p = 5.1e−05; diencephalon (P) 8, 8, p = 0.02. Significance (t-test) is indicated (* p < 0.05, **p < 0.01, ***p < 0.001; ns, not significant).
|
