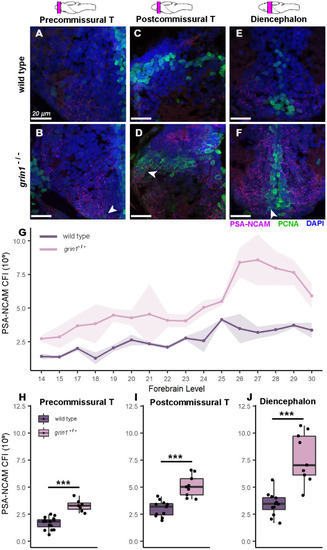
NMDA receptors suppress neuron proliferation in the forebrain. (A–F) PSA-NCAM (red) and PCNA (green) expression with DAPI counterstain in wild-type (A, C, & E) or grin1−/− (B, D, & F) fish at 5 dpf either in the precommissural telencephalon (A & B), postcommissural telencephalon (C & D), or diencephalon (E & F). Brain schematics above images indicate the gross anatomical regions sampled. Brain schematics after Mueller & Wullimann (2016). Arrowheads indicate example cells coexpressing PSA-NCAM and PCNA. (G) Line graph with points showing the mean PSA-NCAM corrected fluorescence intensity (CFI) at each anatomical level assayed from anterior to posterior (left to right). Ribbon surrounding line graph indicates standard error of the mean. Anatomical levels are numbered according to Mueller & Wullimann (2016) (see "Materials and methods"). Wild type n = 16; grin1−/− n = 9. t-test, p = 7.3e−05. (t-test was performed as a comparison of the aggregate mean CFI across the forebrain for each group). (H–J) Box and whisker plots of CFI values within each gross anatomical region. Wild type and grin1−/− sample sizes and p value (t-test): Precommissural telencephalon (H), 16, 7; p = 1.7e−06. Postcommissural telencephalon (I), 11, 9; p = 4.4e−05. Diencephalon (J), 12, 9; p = 0.0003. Significance (t-test) is indicated (***p < 0.001).
|
