|
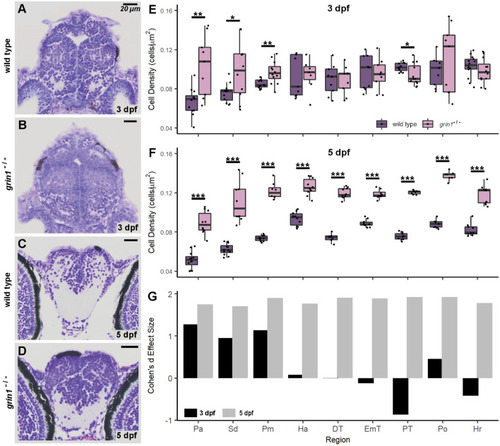
grin1−/− fish have increased cell densities throughout the forebrain. (A–D) Nissl stained 5-micron coronal sections of a 3 dpf wild-type (A) and a grin1−/− (B) fish at the precommissural anterior telencephalon, or of a 5 dpf wild-type (C) and a grin1−/− (D) fish in the anterior telencephalon at the level of the anterior commissure. (E & F) Box and whisker plots of cell density in 9 different anatomical regions in wild-type and grin1−/− fish at 3 dpf (E) and 5 dpf (F). (G) Data in (E) and (F) expressed as Cohen’s d effect sizes demonstrating magnitude and directionality of changes (positive value indicates greater cell density in grin1−/− fish, negative value indicates greater cell density in wild-type fish) in cell density between wild-type and grin1−/− fish, at 3 and 5 dpf, in each anatomical region assayed. Significance (t-test) is indicated (*p < 0.05, **p < 0.01, ***p < 0.001). For specific sample sizes and statistical values see Table 3.
|